
Split Plots - Statistics
All split plots in the same whole plot get the same level of the whole plot treatment factor. All levels of the split plot treatment factor occur in each whole plot. The restricted randomization is equivalent to the two randomizations of the unit structure approach.
Download Split Plots - Statistics

Information
Domain:
Source:
Link to this page:
Documents from same domain

A First Course in Design and Analysis of Experiments
users.stat.umn.eduA First Course in Design and Analysis of Experiments Gary W. Oehlert University of Minnesota
Nathaniel E. Helwig - Statistics
users.stat.umn.eduMultivariate Linear Regression Nathaniel E. Helwig Assistant Professor of Psychology and Statistics University of Minnesota (Twin Cities) Updated 16-Jan-2017
Computing Primer for Applied Linear Regression, …
users.stat.umn.eduThis computer primer supplements Applied Linear Regression, 4th Edition (Weisberg,2014), abbrevi-ated alr thought this primer. The expectation is that you will read the book and then consult this primer to see how to apply what you have learned using R.

On the Markov Chain Central Limit Theorem - Statistics
users.stat.umn.eduOn the Markov Chain Central Limit Theorem Galin L. Jones School of Statistics University of Minnesota Minneapolis, MN, USA galin@stat.umn.edu Abstract The goal of this paper is to describe conditions which guarantee a central limit theorem for functionals of general state space Markov chains. This is done with a view towards Markov

Factor Analysis - University of Minnesota
users.stat.umn.eduFactor Analysis Model Model Form Factor Model with m Common Factors X = (X1;:::;Xp)0is a random vector with mean vector and covariance matrix . The Factor Analysis model assumes that X = + LF + where L = f‘jkgp m denotes the matrix offactor loadings jk is the loading of the j-th variable on the k-th common factor F = (F1;:::;Fm)0denotes the vector of latentfactor scores

Data, Covariance, and Correlation Matrix
users.stat.umn.eduThe Data Matrix R Code Row and Column Means > # get row means (3 ways) > rowMeans(X)[1:3] Mazda RX4 Mazda RX4 Wag Datsun 710 29.90727 29.98136 23.59818
The Adaptive Lasso and Its Oracle Properties
users.stat.umn.eduof Minnesota, Minneapolis, MN 55455 (E-mail: hzou@stat.umn.edu ). The au-thor thanks an associate editor and three referees for their helpful comments and suggestions. Sincere thanks also go to a co-editor for his encouragement. high variability and in addition is often trapped into a local op-timal solution rather than the global optimal solution.

Linear Mixed-Effects Regression - Statistics
users.stat.umn.eduNesting typically introduces correlation into data at level-1 Students are level-1 and schools are level-2 Dependence/correlation between students from same school We need to account for this dependence when we model the data. Nathaniel E. Helwig (U of Minnesota) Linear Mixed-Effects Regression Updated 04-Jan-2017 : Slide 8
Robust Regression - University of Minnesota
users.stat.umn.eduRobust Regression John Fox & Sanford Weisberg October 8, 2013 All estimation methods rely on assumptions for their validity. We say that an estimator or statistical procedure is robust if it provides useful information even if some of the assumptions used to justify the estimation method are not applicable. Most of this appendix concerns robust

Selecting the Number of Bins in a Histogram: A Decision ...
users.stat.umn.eduA Decision Theoretic Approach ... closely tied to our desire to exploit the Bayesian bootstrap to give a sensible solution for this problem. To see how it works in practice we considered eight difierent densities on the unit interval. The flrst was the Uniform
Related documents
Basic Graphics in R - Harvard University
bcb.dfci.harvard.eduPlot of data.frame elements If the rst argument to plot() is a data.frame, this can be as simply as plot(x,y) providing 2 columns (variables in the data.frame). Lets look at the data in the data.frame airquality which measured the 6 air quality in New
LabVIEW Lesson 6 – File I/O and Plotting
boson.physics.sc.eduLabVIEW Lesson 6 – File I/O and Plotting Lesson Overview • Why use file I/O? ... File I/O formats depend on the type of files being used. 3 types of formats exist: text, binary, and datalog. ... the plot lines, the type of data points (useful when plotting multiple sets of data), and many other options. ...

Using SAS’s PROC GPLOT to plot data and lines
cob.jmu.eduUsing SAS’s PROC GPLOT to plot data and lines PROC GPLOT creates “publication quality” color graphics which can easily be exported into documents, presentations, etc. To export the graphs for future use click on file, export. In the dialog box choose a

Basic Plotting with Python and Matplotlib
courses.csail.mit.eduThe basic syntax for creating line plots is plt.plot(x,y), where x and y are arrays of the same length that specify the (x;y) pairs that form the line. For example, let’s plot the cosine function from 2 to 1.

PLOTTING AND GRAPHICS OPTIONS IN MATHEMATICA
dslavsk.sites.luc.eduPLOTTING AND GRAPHICS OPTIONS IN MATHEMATICA In addition to being a powerful programming tool, Mathematica allows a wide array of plotting and graphing options. We will look at a variety of these, starting with the Plot command. ... Plot x, x^2, x^3, x ...

Unit 9 Describing Relationships in Scatter Plots and Line ...
lycofs01.lycoming.edu56 Unit 9 Describing Relationships in Scatter Plots and Line Graphs Objectives: • To construct and interpret a scatter plot or line graph for two quantitative variables
Math 141 - Quantile-Quantile Plots
people.reed.eduThe QQ plot The quantile–quantile plot, or QQplot, is a simple graphical method for comparing two sets of sample quantiles. Plot the pairs of order statistics (X (k);Y (k)): If the two datasets come from the same distribution, the points ... Math 141 - Quantile-Quantile Plots ...

Plotting functions of more than one variable with Mathematica
physics.weber.eduPlotting functions of more than one variable with Mathematica Physics 3510, Weber State University This tutorial assumes that you are already somewhat familiar with Mathematica.
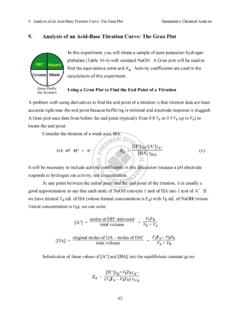
9. Analysis of an Acid-Base Titration Curve: The Gran Plot
web.mnstate.eduThe Gran plot in the acidic region gives accurate results even if there is CO2 dissolved in the strong base titrant. The Gran plot in the basic region can be used to measure CO2 in the strong base. For completeness, we note that if weak base, B, is titrated with a strong acid, the Gran
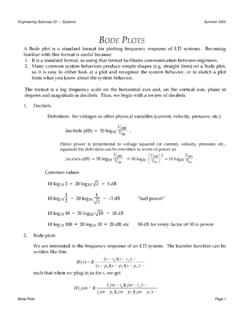
Bode plots
www.dartmouth.eduA Bode plot is a standard format for plotting frequency response of LTI systems. Becoming familiar with this format is useful because: 1. It is a standard format, so using that format facilitates communication between engineers. 2. Many common system behaviors produce simple shapes (e.g. straight lines) on a Bode plot,
Related search queries
Basic Graphics in R, Plot, Lesson 6, File I/O, The Plot, Using SAS’s PROC GPLOT to plot data, Basic Plotting with Python and Matplotlib, PLOTTING AND GRAPHICS OPTIONS IN, Describing Relationships in Scatter Plots, Math 141 - Quantile-Quantile Plots, Plotting functions of more than one variable with Mathematica, Gran plot, Bode plot