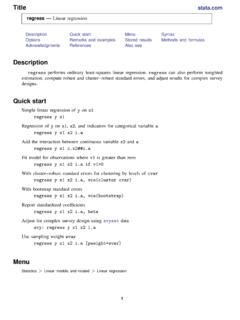
Title stata.com regress — Linear regression
regress performs ordinary least-squares linear regression. regress can also perform weighted estimation, compute robust and cluster–robust standard errors, and adjust results for complex survey ... estimating treatment effects, and providing answers to public policy questions. For a mathematically rigorous treatment, seePeracchi(2001, chap. 6
Download Title stata.com regress — Linear regression

Information
Domain:
Source:
Link to this page:
Documents from same domain

Syntax - Stata
www.stata.com2cluster kmeans and kmedians— Kmeans and kmedians cluster analysis Options Main k(#) is required and indicates that # groups are to be formed by the cluster analysis.

Syntax Description - Stata
www.stata.com2substr()— Extract substring Diagnostics In substr(s, b, l) and substr(s, b), if b describes a position before the beginning of the string or after the end, "" is returned.

Title stata.com generate — Create or change …
www.stata.comTitle stata.com generate — Create or change contents of variable SyntaxMenuDescriptionOptions Remarks and examplesMethods and formulasReferencesAlso see Syntax Create new variable generate type newvar

SyntaxDescriptionRemarks and examplesAlso see
www.stata.commacro— Macro definition and manipulation 3 Macro extended functions related to matrices rownamesjcolnamesjrowfullnamesjcolfullnames matname roweqjcoleq

Title stata.com graph box — Box plots
www.stata.comgraph box— Box plots 3 Menu Graphics > Box plot Syntax graph box yvars if in weight, options graph hbox yvars if in weight, options where yvars is a varlist options Description

Title stata
www.stata.comarea options — Options for specifying the look of special areas 3 Also see [G-2] graph dot — Dot charts (summary statistics)

www.stata.com
www.stata.com2cluster dendrogram— Dendrograms for hierarchical cluster analysis The height of the vertical lines and the range of the (dis)similarity axis give visual clues about the

Title stata.com putexcel — Export results to an Excel …
www.stata.computexcel— Export results to an Excel file 3 export options Description Main overwritefmt overwrite existing cell formatting when exporting new content

destring — Convert string variables to numeric ... - …
www.stata.comTitle stata.com destring — Convert string variables to numeric variables and vice versa SyntaxMenuDescription Options for destringOptions for tostringRemarks and …

Title stata.com gettoken — Low-level parsing
www.stata.comTitle stata.com gettoken — Low-level parsing SyntaxDescriptionOptionsRemarks and examplesAlso see Syntax gettoken emname1 emname2: emname3, parse("pchars") quotes qed(lmacname) match(lmacname) bind
Related documents
Linear Mixed-Effects Regression - University of Minnesota
users.stat.umn.eduRandom effects are random variables in the population Typically assume that random effects are zero-mean Gaussian Typically want to estimate the variance parameter(s) Models with fixed and random effects are calledmixed-effects models. Nathaniel E. Helwig (U of Minnesota) Linear Mixed-Effects Regression Updated 04-Jan-2017 : Slide 9

General Linear Models (GLM) - Statistical Software
ncss-wpengine.netdna-ssl.com2 Specify the General Linear Models (GLM) procedure options • Find and open the General Linear Models (GLM) procedure using the menus or the Procedure Navigator. • The settings for this example are listed below and are stored in the Example 1 settings template. To load this template, click Open Example Template in the Help Center or File menu.

Linear Predictive Coding (LPC)- Introduction
web.ece.ucsb.edurepresents the effects of the glottal pulse shape, the vocal tract IR, and radiation at the lips • the system is excited by an impulse train for voiced speech, or a random noise sequence for unvoiced speech • this ‘all-pole’ model is a natural representation for non-nasal voiced speech—but it also works reasonably

CHAPTER 1: THE OP AMP - Analog Devices
www.analog.comcommon linear design building blocks. In section 1 the basic operation of the op amp will be discussed. We will concentrate on the op amp from the black box point of view. There are a good many texts that describe the internal workings of an op …
Lecture 9: Linear Regression - University of Washington
www.gs.washington.eduFixed -vs- Random Effects Models •In ANOVA and Regression analyses our independent variables can be treated as Fixed or Random •Fixed Effects: variables whose levels are either sampled exhaustively or are the only ones considered relevant to the experimenter •Random Effects: variables whose levels are randomly sampled
An introduction to hierarchical linear modeling - TQMP
www.tqmp.orgmixed level-, mixed linear-, mixed effects-, random effects-, random coefficient (regression)-, and (complex) covariance components-modeling (Raudenbush & Bryk, 2002). These labels all describe the same advanced regression technique that is HLM. HLM simultaneously investigates relationships within and between hierarchical levels of grouped data,
Using the Margins Command to Estimate and Interpret ...
www3.nd.edu• Marginal effects are popular in some disciplines (e.g. Economics) because they often provide a good approximation to the amount of change in Y that will be produced by a 1-unit change in X k. With binary dependent variables, they offer some of the same advantages that the Linear Probability Model (LPM) does –they give you a single number that