Transcription of February 2018 COF Pre-Report Estimates. Urner …
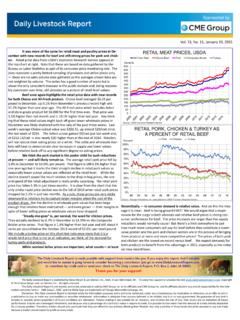
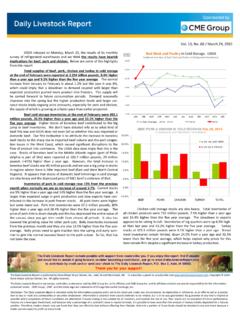
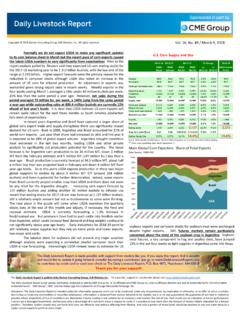
1 Sponsored in part by Copyright 2018 Steiner Consul ng Group, DLR Division, Inc. All rights reserved. Vol. 16, No. 37 / February 21, 2018. USDA will issue on Friday, February 23, the results of its USA Cattle on Feed Inventory monthly survey of feedlots with +1000 head capacity. A survey of Feedlots with +1000 head Capacity. 1st of Month Inventory. '000 head. USDA. analysts conducted by Urner Barry in recent days indicates that for 11,900. the most part analysts agree that placements were about steady to Average Est. 11,700. BEGINNING OF MONTH INVENTORIES, 000 HEAD. maybe a bit higher than a year ago while marke ngs increased + Range signi cantly in January. There was one extra day for marke ng 11,500. ca le in January, which likely bolstered the number of ca le sold. 11,300. On average analysts polled indicated they expect January marke ngs 11,100. to be up compared to a year ago.
2 As usual the focus will be on January placements and the supply of ca le and the weight of the 10,900. ca le placed on feed. Of the 11 analysts that were polled by Urner 10,700. Barry, 5 of them expect January placements to be lower than a year 2013-17 Avg ago. There are some regional reports showing a notable increase in 10,500. 2016. the number of ca le placed on feed and we suspect that may have 10,300. 2017. in uenced some of the analyst calcula ons. 10,100 2018. Dry condi ons in the Southern Plains have been an issue for the last four months and the situa on there has become worse 9,900. JAN FEB MAR APR MAY JUN JUL AUG SEP OCT NOV DEC. recently. The chart on page 2 shows that large parts of the Texas Panhandle and Oklahoma are experiencing either severe or extreme drought condi ons. This has the poten al to push a few more February 2018 COF Pre-Report Estimates. Urner Barry Survey percent of year ago volumes.
3 11 analysts surveyed replacement heifers into the feedlots and also cause a few lighter caves to go into feedlots a bit earlier than expected. In the last three Average Implied Range months of 2017 total ca le placements in Texas were million of Estimates Cattle # of Estimates head, 170,000 head more than a year ago. Texas placements accounted for 22% of overall placements during Q4 of last year and On Feed Feb 1 12,424 - yet the increase in placements there accounted for over a third of the increase in placements. Almost all the addi onal ca le placed Placed on Feed in Jan 2,031 - on feed in the last three months of 2017 in Texas were either light or Marketed in Jan 1,973 - very light ca le. Placements of ca le under 600 pounds increased by 140,000 head and placements of ca le between 600 and 699 pounds increased by 50,000 head. was 924,492 head, lower than a year ago. Auc on sales data But even as more ca le are placed on feed in the Southern was down as well however when we look at auc on sales of +600lb.
4 Plains, there are other factors that will likely limit the rate of Ca le the numbers were similar to a year ago. Direct and video placements in other parts of the country. As we noted in this internet sales of larger feeders were quite a bit lower than a year report a few days ago ( February 15), there were fewer ca le sold in ago. the country, which would imply a net reduc on in the number of Another factor that tempers expecta ons for placements in feeder ca le receipts. Feeder ca le receipt data does not o er a January is the rate of feeder ca le imports. Feeder import data is very strong correla on with placements but analysts look at it as an also weekly. In the four weeks ending January 26 feeder imports indica on of the pace of poten al placements. The data is weekly from Mexico were 58,662 head compared to 74,826 head for the so some mes when you cut o a week tends to impact the nal same period a year ago (22% decline).
5 Imports of feeder ca le from results. Feeder and stocker sales data for the four weeks ending Canada are quite small at the start of the year. During this four week January 26 was million head, lower than the same stretch Canadian feeder imports were 2,157 head, down 45% from period a year ago. Sales data for ca le that were over 600 pounds last year. The Daily Livestock Report is made possible with support from readers like you. If you enjoy this report, find it valuable and would like to sustain it going forward, consider becoming a contributor. Just go to to contribute by credit card or send your check to The Daily Livestock Report, Box 4872, Manchester, NH 03018. Thank you for your support! The Daily Livestock Report is published by Steiner Consul ng Group, DLR Division, To subscribe, support or unsubscribe please visit The Daily Livestock Report is not owned, controlled, endorsed or sold by CME Group Inc.
6 Or its a liates and CME Group Inc. and its a liates disclaim any and all responsibility for the informa on contained herein. CME Group , CME and the Globe logo are trademarks of Chicago Mercan le Exchange, Inc. Disclaimer: The Daily Livestock Report is intended solely for informa on purposes and is not to be construed, under any circumstances, by implica on or otherwise, as an o er to sell or a solicita- on to buy or trade any commodi es or securi es whatsoever. Informa on is obtained from sources believed to be reliable, but is in no way guaranteed. No guarantee of any kind is implied or possible where projec ons of future condi ons are a empted. Futures trading is not suitable for all investors, and involves the risk of loss. Past results are no indica on of future performance. Futures are a leveraged investment, and because only a percentage of a contract's value is require to trade, it is possible to lose more than the amount of money ini ally deposited for a futures posi on.
7 Therefore, traders should only use funds that they can a ord to lose without a ec ng their lifestyle. And only a por on of those funds should be devoted to any one trade because a trader cannot expect to pro t on every trade. Page 2. Sponsored by Vol. 16, No. 37 / February 21, 2018. The Daily Livestock Report is made possible with support from readers like you. If you enjoy reading this report and would like to sustain it going forward, consider becoming a contributor by going to our website: Thank you for your support!