Example: quiz answers
Applications of Random Forest Algorithm
Random Forest One way to increase generalization accuracy is to only consider a subset of the samples and build many individual trees Random Forest model is an ensemble tree-based learning algorithm; that is the algorithms averages predictions over many individual trees The algorithm also utilizes bootstrap aggregating, also known as
Tags:
Information
Domain:
Source:
Link to this page:
Documents from same domain

Syntax - Stata
www.stata.com2cluster kmeans and kmedians— Kmeans and kmedians cluster analysis Options Main k(#) is required and indicates that # groups are to be formed by the cluster analysis.

Syntax Description - Stata
www.stata.com2substr()— Extract substring Diagnostics In substr(s, b, l) and substr(s, b), if b describes a position before the beginning of the string or after the end, "" is returned.

Title stata.com generate — Create or change …
www.stata.comTitle stata.com generate — Create or change contents of variable SyntaxMenuDescriptionOptions Remarks and examplesMethods and formulasReferencesAlso see Syntax Create new variable generate type newvar

SyntaxDescriptionRemarks and examplesAlso see
www.stata.commacro— Macro definition and manipulation 3 Macro extended functions related to matrices rownamesjcolnamesjrowfullnamesjcolfullnames matname roweqjcoleq

Title stata.com graph box — Box plots
www.stata.comgraph box— Box plots 3 Menu Graphics > Box plot Syntax graph box yvars if in weight, options graph hbox yvars if in weight, options where yvars is a varlist options Description

Title stata
www.stata.comarea options — Options for specifying the look of special areas 3 Also see [G-2] graph dot — Dot charts (summary statistics)

www.stata.com
www.stata.com2cluster dendrogram— Dendrograms for hierarchical cluster analysis The height of the vertical lines and the range of the (dis)similarity axis give visual clues about the

Title stata.com putexcel — Export results to an Excel …
www.stata.computexcel— Export results to an Excel file 3 export options Description Main overwritefmt overwrite existing cell formatting when exporting new content

destring — Convert string variables to numeric ... - …
www.stata.comTitle stata.com destring — Convert string variables to numeric variables and vice versa SyntaxMenuDescription Options for destringOptions for tostringRemarks and …

Title stata.com gettoken — Low-level parsing
www.stata.comTitle stata.com gettoken — Low-level parsing SyntaxDescriptionOptionsRemarks and examplesAlso see Syntax gettoken emname1 emname2: emname3, parse("pchars") quotes qed(lmacname) match(lmacname) bind
Related documents
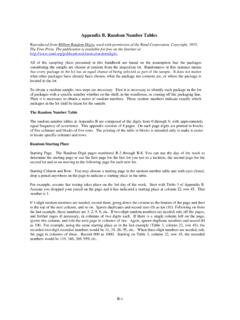
Appendix B. Random Number Tables
www.nist.govApr 28, 2017 · Random Starting Place Starting Page. The Random Digit pages numbered B-2 through B-8. You can use the day of the week to determine the starting page or use the first page for the first lot you test in a location, the second page for the second lot and so on moving to the following page for each new lot. Starting Column and Row.
3 Discrete Random Variables and Probability Distributions
www.colorado.edu6 Probability Distributions for Discrete Random Variables Probabilities assigned to various outcomes in the sample space S, in turn, determine probabilities associated with the values of any particular random variable defined on S. The probability mass function (pmf) of X , p(X) describes how the total probability is distributed among all the
Chapter 4 Multivariate distributions
www.bauer.uh.eduLet X, Y, Z denote 3 jointly distributed random variable with joint density function then 2 01,0 1,0 1,, 0otherwise Kx yz x y z fxyz Find the value of K. Determine the marginal distributions of X, Y and Z. Determine the joint marginal distributions of …

Chapter 3 Continuous Random Variables
www.pnw.educontinuous random variables, the density curve is integrated to determine probability. Exercise 3.1(Introduction) Patient’s number of visits, X, and duration of visit, Y.
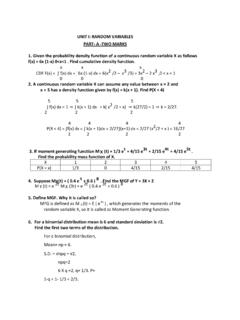
UNIT I: RANDOM VARIABLES PART- A -TWO MARKS 2. A ...
pradeepchandrasekar.weebly.comrandom variable X, so it is called as Moment Generating function. 6. For a binomial distribution mean is 6 and standard deviation is ... Determine the distribution whose M.G.F is MX ( t ) = e 3 ...

Quantitative Research Designs: Experimental, Quasi ...
samples.jbpub.comTrue experimental research involves random assignment to groups so participants each have an equal chance of receiving any of the treatments ... When you read a study, first read the abstract to determine whether there is an intervention. If so, the study is either experimental or quasi-experimental. If not, the study will fit into one of the ...

How to determine the degrees of freedom in One-way and …
www.mathstat.dal.ca) random variable, which has an F distribution with two DFs (often called . numerator. and . denominator DF; also called . df1. and . df2. respectively) and is used to find the . p-value for the ANOVA test. In a . One-way ANOVA. with . a. samples (i.e., treatment groups) and there are . n. observations in total among the . a. samples, the ...

Chap 3 : Two Random Variables
www.ee.ryerson.caChap 3: Two Random Variables Chap 3 : Two Random Variables Chap 3.1: Distribution Functions of Two RVs In many experiments, the observations are expressible not as a single quantity, but as a family of quantities. For example to record the height and weight of each person in a community or
Introduction to Stochastic Processes - Lecture Notes
web.ma.utexas.edua random variable can be thought of as an uncertain, numerical (i.e., with values in R) quantity. While it is true that we do not know with certainty what value a random variable Xwill take, we usually know how to compute the probability that its value will be in some some subset of R.