Transcription of AQA STATISTICS 1 REVISION NOTES - Mathsbox
1 AVERAGES AND MEASURES OF SPREAD Mode :the most common or most popular data valuethe only average that can be used for qualitative datanot suitable if the data values are very varied Mean:important as it uses all the data valuesDisadvantage affected by extreme values Median:the middle value when the data are in orderFor n data values the median is then+1 th valueNot affected by extreme values Range biggest value smallest value- greatly affected by extreme values Interquartile Range Upper quartile Lower quartile- measures the spread of the middle 50% of the data and is not affected byextreme valuesIQR = 9 - 4 = 5 IQR = = 4 Standard DeviationDeviation from the mean is the difference from a value from the mean valueThe standard deviation is theaverage of all of these deviationsFormulas to work out standard deviation are given in theq SCALING DATAA dditionif you adda to each number in
2 The list of data :New mean = old mean+ aNew median = old median+ aNew mode = old mode+ aStandard Deviation is UNCHANGEDM ultiplication - If you multiply each number in the list of data byb :New mean = old mean bNew median = old median bNew mode = old mode bNew Standard Deviation = old standard deviation bIf the data is grouped use the mid-point of each group as your x2 For 10 values the medianwill be the 5 th value halfway between the 5thand the 6th values345 7899LQ M UQ2 3 4 4 5789 LQM UQAQA STATISTICS 1 REVISION : each thing that can happen in an experimentSample Space :list of all the possible valuesq NOTATIONA and B both happeneither A or B or both happenC doesn t happen P(C ) = 1 P(C) Mutually Exclusive Eventstwo or more events that cannot happen at the same timeIndependent Eventsthe outcome of one event does not affect the outcome of anotherP( B) = P(A) P(B)Conditional Probability.
3 When the outcome of the first event affects the outcome of asecond event, the probability of the second event depends on what has happened P(B/A) means theconditionalprobability of B given AP(B/A) = (AB)so P( B)= P(A) P(B/A)q If the question states that the events areindependent then a tree diagram might be agood idea multiply along the branches then add the appropriate combinations togetherq Probability of at least 1 =1 Probability of none q If you are asked to find probabilities using data in a table work out the row/columntotals before you startA BA BC'CP(A B) = P(A) + P(B) P(A B)P(A B) = P(A) + P(B)P P(A)A A DISTRIBUTIONq A question is binomial if.
4 Probability of an event happening is given (p) Number of people/trials/objects chosen given (n)q EQUALS or EXACTLY use the formula P(x=r)Make sure you write it out with the values substituted inq MORE/LESS THAN/AT LEAST use tablesRemember tables give less than or equal toMake sure you list the numbers and identify which ones you need to includeP(X>5) 0 1 2 3 4 5 6 7 8 9 = 1 P(X 5)P(X<5) 0 1 2 3 4 5 6 7 8 = P(X 4)q MEAN and VARIANCEMean = np Variance = np(1-p) standard deviation =q ASSUMPTIONSI ndependent events with a fixed probability of successRandomly selectedq COMPARISONSYou may be asked to calculate the mean and standard deviation of a binomial distributionand compare them to the mean and standard deviation of a sample (table of results) - ifboth the means are approximately the same AND both standard deviations (or variances) areapproximately equal then you can say that binomial model appears to fit the data and that itmust be independent, random Crpr(1 p)n rfrom your calculator make sureyou write down this valueCheck that your powers addto make n (number of trials)np(1 p)
5 DISTRIBUTIONFINDING PROBABILITIESq State the mean and variance (standard deviation)q Standardise to find the z valueq Sketch a graph and shade in the area to represent the probabilityq Use the table to find the probability - take care with negative z-values P(z > ) = P(z < )P(z < ) = 1 P(z < )q ALWAYS CHECK YOUR ANSWER WITH YOUR GRAPH if your shaded area is more that and your answer is (for example) you know you have gone wrong somewhere!!WORKING BACKWARDS to find the mean/standard deviation or both(simultaneous equations)q State the probability you know and sketch a graphP(X < 34) = Use tables to find the appropriate z valueq Write down the equation used to standardise with all of the known values substitutedq Rearrange to find the =x meanstandard deviationP(z < )P(z > ) deviation = = 34 and PROBABILITIESIf you are asked to calculate probabilities involving samples remember to divide the(population)
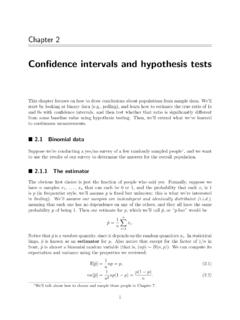
6 Standard deviation by the square root of the sample size when you estimating the population mean from a sample mean and finding a confidence intervalq CASE 1 :Standard deviation or Varianceof the population isstated in the question- from the data you only need to calculate the mean- use your tables to find the appropriate z value -write out the above expressions for the confidence intervals with all your values substituted in- calculate the two values for your confidence intervals and state clearly (3 sf)CHECK your answer add the two answers together and divide by 2 this should be the sample mean!!!q CASE 2 :Standard deviation or Variance of the population isUNKNOWN- you will need to use the data to calculate the variance of the sample and then anunbiasedestimate of the population variance- your calculator will give you value of the standard deviation for the sample you have enteredsxn- square this to calculate thesample varianceAnunbiased estimate of the population varianceisUse this as the value of in your confidence interval when substituting the values inq INTERPRETATION a 95% confidence interval tells us that if we took the same sizesample 100 times then 95 of the confidence intervals we would calculate shouldcontain the TRUE
7 Population =x meansnor z =x meanvariancenIf a random sample of size n is taken from a normal population and the samplemeanx is found, then the 95% confidence interval of the population mean isgiven bywheres is either the population variance (if given) or an unbiased estimateof the population variance (found from the sample see below)x s2n , x + s2n2 Zvaluenn 1 Sample LIMIT THEOREM you only need to use the central limit theorem if you arenot told that the sample is selectedfrom a population which is Normally DistributedThe theorem concerns the distribution of the sample means and as long as the samplesize is large enough (greater than 30)
8 Then the sample means will be normallydistributed and so we can calculate confidence intervalsREGRESSION finding the equation of the line of best fit least squaresy = a + bxq If you are asked to interpret the values of a and b, make sure you discuss it in the context of thequestion NOT in terms of x and y (see examples above)q If you are give a table of values use your calculator to find a and bIn your workings statea = .. b =..and show your values substituted intoy = a + bxq If you are calculating a and b using the formulae make sure you use the formula book showing how you substituted the values inAlways work out b firstUse b and the means of x and y to work out a a = (mean of y) - b(mean of x)q TO PLOT THE REGRESSION LINE choose 2 different values of x use your equation y=a + bxto work out the predicted y-values - plot the two points and join with a straight lineq RESIDUAL= OBSERVED(actual value) PREDICTED(using equation y= a + bx)
9 - the smaller the residuals the greater the accuracy of the line of best fit in predicting values- sometimes an average residual can be used to make predictions using the line of best fit ifan individual has an average residual of 5 then to predict for this particular person using the line, 5should be added to the value predicted using the RELIABILITY OF PREDICTIONS-Interpolationpredicting using an x-value within the range of x-values used to calculate the a and bconsidered to be a reliable prediction-Extrapolationpredicting using an x-value outside of the range of x-values used to calculate a and bUNRELIABLE estimate- because you are assuming that the linear trend continues indefinitely use yourcommon sense to explain why this may be incorrect- watch out for NEGATIVE (or unrealistic)
10 Y values which may result for the x valuessuggested again use your common sense to explain why this is unrealisticIntercept - the value of y when x is When the temperature is 0 C ice cream salesare 10 Gradient the change in y for each unit change in for every 1 degree rise in temperature sales increase by SCALING either the x or the y values will change the y = the x values are doubled then the equation becomes y = (2x)y = 5 is added on to each of the y values then the equation becomesy + 5 = = - x (always rearrange to get y = a + b x)CORRELATIONThe Product Moment Correlation Coefficient.