Transcription of Chapter 18 The BOXPLOT Procedure
1 Chapter 18 The BOXPLOT ProcedureChapter Table of ..398 PLOTS tatement .. Statistics Represented by Box Plots ..418 Input Data Set ..418 StylesofBoxPlots ..418 Percentile Definitions ..419 MissingValues ..420 Continuous Group .. Using Box Plots to Compare Groups .. Chapter 18. The BOXPLOT ProcedureSAS OnlineDoc : Version 8 Chapter 18 The BOXPLOT ProcedureOverviewThe BOXPLOT Procedure creates side-by-side box-and-whisker plots of measure-ments organized in groups. A box-and-whisker plot displays the mean, quartiles, andminimum and maximum observations for a group. Throughout this Chapter , this typeof plot, which can contain one or more box-and-whisker plots, is referred to as PLOT statement of the BOXPLOT Procedure produces a box plot.
2 You canspecify more than one PLOT statement to produce multiple box can use options in the PLOT statement to control the style of the box-and-whisker plots specify one of several methods for calculating quantile statistics (percentiles) add block legends and symbol markers to reveal stratification in data display vertical and horizontal reference lines control axis values and labels control the layout and appearance of the plotGetting StartedThis section demonstrates how you can use the BOXPLOT Procedure to produce boxplots for your that a petroleum company uses a turbine to heat water into steam that ispumped into the ground to make oil more viscous and easier to extract. This processoccurs 20 times daily, and the amount of power (in kilowatts) used to heat the waterto the desired temperature is recorded.
3 The following statements create a SAS dataset calledTu r b i n ethat contains the power output measurements for 20 work Turbine;informat day date7.;format day date5.;label kwatts= Average Power Output ;input day @;do i=1 to 10;input kwatts @;output;end;396 Chapter 18. The BOXPLOT Proceduredrop i;datalines;05 JUL94 3196 3507 4050 3215 3583 3617 3789 3180 3505 345405 JUL94 3417 3199 3613 3384 3475 3316 3556 3607 3364 372106 JUL94 3390 3562 3413 3193 3635 3179 3348 3199 3413 356206 JUL94 3428 3320 3745 3426 3849 3256 3841 3575 3752 334707 JUL94 3478 3465 3445 3383 3684 3304 3398 3578 3348 336907 JUL94 3670 3614 3307 3595 3448 3304 3385 3499 3781 371108 JUL94 3448 3045 3446 3620 3466 3533 3590 3070 3499 345708 JUL94 3411 3350 3417 3629 3400 3381 3309 3608 3438 356711 JUL94 3568 2968 3514 3465 3175 3358 3460 3851 3845 298311 JUL94 3410 3274 3590 3527 3509 3284 3457 3729 3916 363312 JUL94 3153 3408 3741 3203 3047 3580 3571 3579 3602 333512 JUL94 3494 3662 3586 3628 3881 3443 3456 3593 3827 357313 JUL94 3594 3711 3369 3341 3611 3496 3554 3400 3295 300213 JUL94
4 3495 3368 3726 3738 3250 3632 3415 3591 3787 347814 JUL94 3482 3546 3196 3379 3559 3235 3549 3445 3413 385914 JUL94 3330 3465 3994 3362 3309 3781 3211 3550 3637 362615 JUL94 3152 3269 3431 3438 3575 3476 3115 3146 3731 317115 JUL94 3206 3140 3562 3592 3722 3421 3471 3621 3361 337018 JUL94 3421 3381 4040 3467 3475 3285 3619 3325 3317 347218 JUL94 3296 3501 3366 3492 3367 3619 3550 3263 3355 351019 JUL94 3795 3872 3559 3432 3322 3587 3336 3732 3451 321519 JUL94 3594 3410 3335 3216 3336 3638 3419 3515 3399 370920 JUL94 3850 3431 3460 3623 3516 3810 3671 3602 3480 338820 JUL94 3365 3845 3520 3708 3202 3365 3731 3840 3182 367721 JUL94 3711 3648 3212 3664 3281 3371 3416 3636 3701 338521 JUL94 3769 3586 3540 3703 3320 3323 3480 3750 3490 339522 JUL94 3596 3436 3757 3288 3417 3331 3475 3600 3690 353422 JUL94 3306 3077 3357 3528 3530 3327 3113 3812 3711 359925 JUL94 3428 3760 3641 3393 3182 3381 3425 3467 3451 318925 JUL94 3588 3484 3759 3292 3063 3442 3712 3061 3815 333926 JUL94 3746 3426 3320 3819 3584 3877 3779 3506 3787 367626 JUL94 3727 3366 3288 3684 3500 3501 3427 3508 3392 381427 JUL94 3676 3475 3595 3122 3429 3474 3125 3307 3467 383227 JUL94 3383 3114 3431 3693 3363 3486 3928 3753 3552 352428 JUL94 3349 3422 3674 3501 3639 3682 3354 3595 3407 340028 JUL94 3401 3359 3167 3524 3561 3801 3496 3476 3480 357029 JUL94 3618 3324 3475 3621 3376 3540 3585 3320 3256 344329 JUL94 3415 3445 3561 3494 3140 3090 3561 3800 3056 353601 AUG94 3421 3787 3454 3699 3307 3917 3292 3310 3283 353601 AUG94 3756 3145 3571 3331
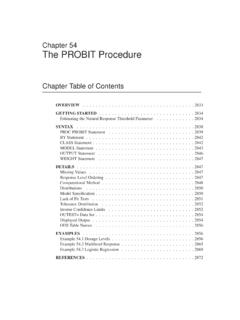
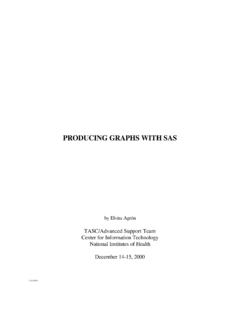
5 3725 3605 3547 3421 3257 3574;run;In the data setTu r b i n e, each observation contains the date and the power output fora single heating. The first 20 observations contain the outputs for the first day, thesecond 20 observations contain the outputs for the second day, and so on. Becausethe variabledayclassifies the observations into rational groups, it is referred to asthegroup variable. The variablekwattscontains the output measurements and isreferred to as theanalysis OnlineDoc : Version 8 Getting Started 397 You can create a box plot to examine the distribution of power output for each following statements create the box plot shown in Figure color = salmon h = .8;goptions ftext=swiss;axis1 minor=none color=black label=(angle=90 rotate=0);title Box Plot for Power Output ;proc BOXPLOT data=Turbine;plot kwatts*day/ cframe = vligbcboxes = dagrcboxfill = ywhvaxis = axis1;run;The input data setTu r b i n eis specified with the DATA= option in thePROC BOXPLOT PLOT statement requests a box-and-whiskerplot for each group of data.
6 After the keyword PLOT, you specify the analysisvariable (in this case,kwatts), followed by an asterisk and the group variable (day).Figure Plot for Power Output DataThe box plot displayed in Figure represents summary statistics for the analysisvariablekwatts; each of the 20 box-and-whisker plots describes the variablekwattsfor a particular day. The plot elements and the statistics they represent are as follows. the length of the box represents the interquartile range (the distance betweenthe25th and the75th percentiles)SAS OnlineDoc : Version 8398 Chapter 18. The BOXPLOT Procedure the dot in the box interior represents the mean the horizontal line in the box interior represents the median the vertical lines issuing from the box extend to the minimum and maximumvalues of the analysis variableSyntaxThe syntax for the BOXPLOT Procedure is as follows:PROC BOXPLOT <options>;PLOT analysis-variable*group-variable<(block-variables)> <=symbol-variable> </options>;BYvariables;IDvariables;Both the PROC BOXPLOT and PLOT statements are required.
7 You can specify anynumber of PLOT statements within a single PROC BOXPLOT BOXPLOT StatementPROC BOXPLOT <options>;The PROC BOXPLOT statement starts the BOXPLOT Procedure . The followingoptions can appear in the PROC BOXPLOT an ANNOTATE= type data set, as described inSAS/GRAPH Software: Ref-erence, that enhances all box plots requested in subsequent PLOT the SAS data set containing the data to be analyzed. If you omit the DATA=option, the Procedure uses the most recently created SAS data <libref.>output catalogspecifies the SAS catalog in which to save the graphics output that is produced by theBOXPLOT Procedure . If you omit the libref, PROC BOXPLOT looks for the catalogin the temporary library called WORK and creates the catalog if it does not OnlineDoc : Version 8 PLOT Statement 399 PLOT StatementPLOT(analysis-variables)*group- variable<(block-variables)> <=symbol-variable> </options>;You can specify multiple PLOT statements after the PROC BOXPLOT components of the PLOT statement are as one or more variables to be analyzed.
8 An analysis vari-able is required. If you specify more than one analysis variable,enclose the list in parentheses. For example , the following state-ments request distinct box plots for the variablesweight,length,andwidth:proc BOXPLOT data=summary;plot (weight length width)*day;run;group-variablespecifies the variable that identifies groups in the data. The groupvariable is required. In the preceding PLOT statement,dayis thegroup optional variables that group the data into blocks of con-secutive groups. These blocks are labeled in a legend, and eachblock variable provides one level of labels in the an optional variable whose levels (unique values) deter-mine the symbol marker used to plot the means. Distinct symbolmarkers are displayed for points corresponding to the various levelsof the symbol variable.
9 You can specify the symbol markers withSYMBOL nstatements (refer toSAS/GRAPH Software: Referencefor complete details).optionsenhance the appearance of the box plot, request additional analy-ses, save results in data sets, and so on. Complete descriptions foreach option lists all options in the PLOT statement by Statement OptionsOptionDescriptionOptions for Controlling Box AppearanceBOXCONNECT connects group means in box-and-whisker plotsBOXCONNECT=connects group means, medians, maximum values, minimum val-ues, or quartiles in box-and-whisker plotsBOXSTYLE=specifies style of box-and-whisker plotsBOXWIDTH=specifies width of box-and-whisker plotsSAS OnlineDoc : Version 8400 Chapter 18. The BOXPLOT ProcedureTable (continued)OptionDescriptionBOXWIDTHSCAL E=specifies that widths of box-and-whisker plots vary proportion-ately to group sizeCBOXES=specifies color for outlines of box-and-whisker plotsCBOXFILL=specifies fill color for interior of box-and-whisker plotsIDCOLOR=specifies outlier symbol color in schematic box-and-whisker plotsIDCTEXT=specifies outlier label color in schematic box-and-whisker plotsIDFONT=specifies outlier label font in schematic box-and-whisker plotsIDHEIGHT=specifies outlier label height in schematic box-and-whisker plotsIDSYMBOL=specifies outlier symbol in schematic box-and-whisker plotsLBOXES=specifies line types for outlines of box-and-whisker plotsNOSERIFS eliminates serifs from the whiskers of box-and-whisker plotsNOTCHES specifies that
10 Box-and-whisker plots are to be notchedPCTLDEF=specifies percentile definition used for box-and-whisker plotsOptions for Plotting and Labeling PointsCCONNECT=specifies color for line segments that connect points on plotSYMBOLLEGEND=specifies LEGEND statement for levels of the symbol variableSYMBOLORDER=specifies order in which symbols are assigned for levels of the sym-bol variableReference Line OptionsCHREF=specifies color for lines requested by HREF= optionCVREF=specifies color for lines requested by VREF= optionHREF=specifies position of reference lines perpendicular to horizontalaxis on box plotHREFLABELS=specifies labels for HREF= linesHREFLABPOS=specifies position of HREFLABELS= labelsLHREF=specifies line type for HREF= linesLVREF=specifies line type for VREF= linesNOBYREF specifies that reference line information in a data set is to be ap-plied uniformly to plots created for all BY groupsVREF=specifies position of reference lines perpendicular to vertical axison box plotVREFLABELS=specifies labels for VREF= linesVREFLABPOS=specifies position of VREFLABELS= labelsBlock Variable Legend OptionsBLOCKLABELPOS=specifies position of label for the block variable legendBLOCKLABTYPE=specifies text size of the block variable legendBLOCKPOS=specifies vertical position of the block variable legendSAS OnlineDoc.