Transcription of EL 713: Digital Signal Processing Extra Problem Solutions
1 The following 9-point signals, 0 n 8.(a) [3,2,1,0,0,0,0,2,1](b) [3,2,1,0,0,0,0, 2, 1](c) [3,2,1,0,0,0,0, 2, 1](d) [0,2,1,0,0,0,0, 2, 1](e) [0,2,1,0,0,0,0,2,1](f) [3,2,1,0,0,0,0,1,2](g) [3,2,1,0,0,0,0, 1, 2](h) [0,2,1,0,0,0,0, 1, 2](i) [0,2,1,0,0,0,0,1,2]Which of these signals have a real-valued 9-point DFT? Which of these signals have an imaginary-valued 9-point DFT? Do not use MATLAB or any computer to solve this Problem and do not explicitlycompute the DFT; instead use the properties of the :Signals (f) and (i) both have purely real-valued DFT. Signal (h) has a purly imaginary-valued DFT. 14EL 713: Digital Signal ProcessingExtra Problem SolutionsProf. Ivan Selesnick, Polytechnic each discrete-time Signal with its DFT by filling out the following table.
2 You shouldbe able to do this Problem with out using a 713: Digital Signal ProcessingExtra Problem SolutionsProf. Ivan Selesnick, Polytechnic University0102030 1 10102030 1 20102030 1 30102030 1 40102030 1 50102030 1 60102030 1 70102030 1 816EL 713: Digital Signal ProcessingExtra Problem SolutionsProf. Ivan Selesnick, Polytechnic University01020300102030 DFT 101020300102030 DFT 201020300102030 DFT 301020300102030 DFT 401020300102030 DFT 501020300102030 DFT 601020300102030 DFT 701020300102030 DFT 8 Solution: Signal 1 has exactly two cycles of a cosine, so you would expectX(2)andX( 2)to be nonzero, andother DFT coefficients to be 0; that gives DFT 4. Note thatX( 2)is reallyX(N 2). Signal 2 has two and a half cycles of a cosine, so you would expect the DFT to have a peak at indexk= , but that is not an integer there is no DFT coefficient at that index.
3 So the largest DFTcoefficients would be atk= 2andk= 3and there would be leakage . There would also be a peak17EL 713: Digital Signal ProcessingExtra Problem SolutionsProf. Ivan Selesnick, Polytechnic Universityaroundk=N This gives DFT reasons are used for signals 3 and DFT of a constant is an impulse, so Signal 6 corresponds to DFT 7. The DFT of an impulse is aconstant, so Signal 7 corresponds to DFT DTFT of a rectangular pulse is a Digital sinc function, so the DFT of a rectangular pulse is samplesof the sinc function. So Signal 8 corresponds to DFT leaves Signal 5 and DFT 8. Signal 5 can be written as a cosine times a rectangular pulse, so theDFT of Signal 5 will be the convolution of a DFT of a cosine with the DFT of rectangular pulse thatis a sum of two shifted Digital sinc 18EL 713: Digital Signal ProcessingExtra Problem SolutionsProf.
4 Ivan Selesnick, Polytechnic analog signalx(t) is band -limited to 40 Hz. Suppose the Signal is sampled at the rate of 100samples per second and that at this rate 200 samples are collected. Then 200 zeros are appended tothe 200 samples to form a 400-point vector. Then the 400-point DFT of this vector is computed to getX(k) for 0 k 399.(a) Which DFT coefficients are free of aliasing?(b) The DFT coefficientX(50) represents the spectrum of the analog Signal at what frequencyf?(Give your answer in Hz).Solution:(a) All of the DFT coefficients are free of aliasing. The sampling rate is more that twice the maximumsignal frequency.(b) The DFT bin width is100/400or Hz. The 50th DFT coefficient corresponds to the frequency50times Hz 34EL 713: Digital Signal ProcessingExtra Problem SolutionsProf.
5 Ivan Selesnick, Polytechnic diagrams on the following three pages show the impulse responses, pole-zero diagrams,and frequency responses magnitudes of 8 discrete-time causal LTI systems. But the diagrams are outof order. Match each diagram by filling out the following responsePole-zeroFrequency response1234567852EL 713: Digital Signal ProcessingExtra Problem SolutionsProf. Ivan Selesnick, Polytechnic University0510152025 1 RESPONSE 30510152025 1 RESPONSE 40510152025 1 RESPONSE 70510152025 1 RESPONSE 10510152025 1 RESPONSE 80510152025 1 RESPONSE 20510152025 1 RESPONSE 60510152025 1 RESPONSE 553EL 713: Digital Signal ProcessingExtra Problem SolutionsProf. Ivan Selesnick, Polytechnic University 1 1 partimag partPOLE ZERO DIAGRAM 8 1 1 partimag partPOLE ZERO DIAGRAM 4 1 1 partimag partPOLE ZERO DIAGRAM 2 1 1 partimag partPOLE ZERO DIAGRAM 6 1 1 partimag partPOLE ZERO DIAGRAM 5 1 1 partimag partPOLE ZERO DIAGRAM 3 1 1 partimag partPOLE ZERO DIAGRAM 1 1 1 partimag partPOLE ZERO DIAGRAM 754EL 713: Digital Signal ProcessingExtra Problem SolutionsProf.
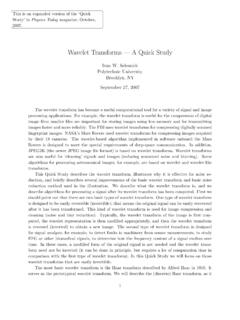
6 Ivan Selesnick, Polytechnic University 1 / FREQUENCY RESPONSE 7 1 / FREQUENCY RESPONSE 5 1 / FREQUENCY RESPONSE 6 1 / FREQUENCY RESPONSE 8 1 / FREQUENCY RESPONSE 1 1 / FREQUENCY RESPONSE 4 1 / FREQUENCY RESPONSE 2 1 / FREQUENCY RESPONSE 3 Solution:55EL 713: Digital Signal ProcessingExtra Problem SolutionsProf. Ivan Selesnick, Polytechnic UniversityImpulse responsePole-zeroFrequency response168234387445573612726851 56EL 713: Digital Signal ProcessingExtra Problem SolutionsProf. Ivan Selesnick, Polytechnic An FIR Digital filter has the transfer functionH(z) = (1 z 1)3(1 +z 1)3(a) Sketch the pole-zero diagram of this system.(b) Sketch|Hf( )|.(c) Would you classify this as a low- pass , high- pass , band - pass , or band -stop filter? Please :Note that because the zero atz= 1is of third order, not only isHf( = 0)equal to one, but so is itsfirst and second derivative, so the frequency response is flat at = 0.
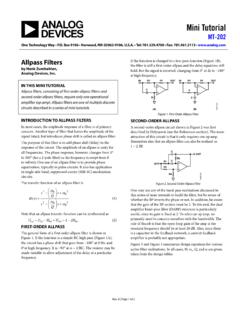
7 The same is true for = . 1 1 PartImaginary Part 1 |H( )| 4 Linear-Phase FIR Digital Filters59EL 713: Digital Signal ProcessingExtra Problem SolutionsProf. Ivan Selesnick, Polytechnic For the transfer functionH(z) =z 1+z 6of an FIR linear-phase filter,(a) sketch the impulse response(b) what is the type of the filter (I, II, III, or IV)?(c) sketch the frequency response magnitude|Hf( )|.(d) sketch the zero diagramSolution:This is a Type 2 FIR find the zeros ofH(z),z 1+z 6= 0(17)z5+ 1 = 1(18)z5= 1(19)z5=ej (20)z5=ej +j2 k(21)z=ej /5+j(2 /5)k(22)which for different integer values ofkgives the valuesz=ej /5,z=ej3 /5,z=ej5 /5= 1,z=ej7 /5,z=ej9 /5, and which are shown in the zero 1 RESPONSE 101 1 PartImaginary PartZEROS OF H(z) 4 /5 3 /5 2 /5 /50 /52 /53 /54 /5 |H( )| 4 /5 3 /5 2 /5 /50 /52 /53 /54 /5 2 1012A( ) All the zeros lie on the unit circle, with equal spacing between them.
8 From that, we can sketch thefrequency response. 65EL 713: Digital Signal ProcessingExtra Problem SolutionsProf. Ivan Selesnick, Polytechnic each impulse response with its frequency response and zero diagram by filling outthe following table. You should do this Problem with out using a ResponseZero DiagramFrequency ResponseABCD0246 2 1012 IMPULSE RESPONSE A0246 2 1012 IMPULSE RESPONSE B0246 2 1012 IMPULSE RESPONSE C0246 2 1012 IMPULSE RESPONSE D69EL 713: Digital Signal ProcessingExtra Problem SolutionsProf. Ivan Selesnick, Polytechnic University 1 1 PartImaginary PartZPLANE A 1 1 PartImaginary PartZPLANE B 1 1 PartImaginary PartZPLANE C 1 1 PartImaginary PartZPLANE / FREQ RESP / FREQ RESP / FREQ RESP / FREQ RESP DSolution:70EL 713: Digital Signal ProcessingExtra Problem SolutionsProf.
9 Ivan Selesnick, Polytechnic UniversityImpulse ResponseZero DiagramFrequency ResponseACBBADCBADDC 71EL 713: Digital Signal ProcessingExtra Problem SolutionsProf. Ivan Selesnick, Polytechnic Filter Matching following Matlab code fragment defines the impulse responses of four different FIR Digital filters.>> h1 = [2 7 7 2];>> h2 = h1 .* ((-1).^(0:5));>> h3 = conv(h2,[1 -1]);>> h4 = h3 .* ((-1).^(0:6));Without consulting MATLAB, match each of the two filters,h3andh4, with their pole-zero diagramsshown ResponsePole-Zero Diagramh3h4 101 1 1 101 1 2 101 1 3 101 1 4 101 1 5 101 1 6 101 1 7 101 1 879EL 713: Digital Signal ProcessingExtra Problem SolutionsProf. Ivan Selesnick, Polytechnic UniversitySolution:Note that h1 is a lowpass filter of Type 2.
10 Also, from the code, we see thath2(n) = ( 1)nh1(n), so h2is a highpass filter of Type 4. From the code we have thatH3(z) =H2(z) (1 z 1)which puts a nullin the frequency response at = 0. Since h2 already has a zero atz= 1, h3 will have a double zero atz= 1and will be a Type 1 filter. So h3 will correspond to pole-zero diagram 4 or 6. (This is not sucha good exercise!) From the code we haveh4(n) = ( 1)nh3(n)orH4(z) =H3( z)which will negateall the zeros ofH3(z)so h4 will correspond to pole-zero diagram 3 or 8. 80EL 713: Digital Signal ProcessingExtra Problem SolutionsProf. Ivan Selesnick, Polytechnic following figures show 6 impulse responses, frequency responses, and zero diagrams. Match eachfrequency response and zero diagram to the corresponding impulse ResponseFrequency ResponseZero Diagram1234560246 1 RESPONSE 10246 1 RESPONSE 20246 1 RESPONSE 30246 1 RESPONSE 40246 1 RESPONSE 50246 1 RESPONSE 681EL 713: Digital Signal ProcessingExtra Problem SolutionsProf.