Example: stock market
Excel Basics for Account Reconciliation
Specifically, you can use Excel to track data, build models for analyzing data, write formulas to perform calculations on that data, pivot the data in numerous ways, and present data in …
Tags:
Information
Domain:
Source:
Link to this page:
Documents from same domain
What Do Transnational Terrorists Target? Has It …
www.utdallas.eduWhat Do Transnational Terrorists Target? Has It Changed? Are We Safer? Patrick T. Brandt pbrandt@utdallas.edu School of Economic, Political and Policy Sciences
HOW TO WRITE A PROFESSIONAL RESUME - …
www.utdallas.eduTALIA ROSS Massachusetts – 500.555.4569 – [email protected] PROFILE Detail-oriented, high-energy Chemical Engineering graduate …
Chapter 23
www.utdallas.eduChapter 23 Partial Least Squares Methods: Partial Least Squares Correlation and Partial Least Square Regression Herve´ Abdi and Lynne J. Williams
Principal component analysis - University of Texas …
www.utdallas.eduWIREs ComputationalStatistics Principal component analysis TABLE 1 Raw Scores, Deviations from the Mean, Coordinate s, Squared Coordinates on …
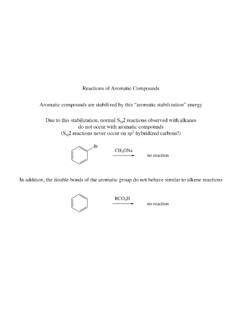
Reactions of Aromatic Compounds Aromatic …
www.utdallas.eduAromatic Substitution! While aromatic compounds do not react through addition reactions seen earlier! Br 2 Br Br Br 2 FeBr 3 Br With an appropriate catalyst, benzene will react with bromine!
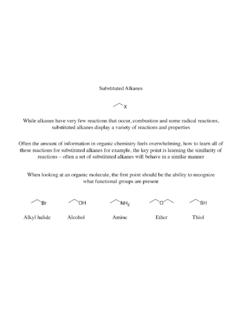
Substituted Alkanes - The University of Texas at …
www.utdallas.eduSubstituted Alkanes! While alkanes have very few reactions that occur, combustion and some radical reactions, substituted alkanes display a variety of reactions and properties!
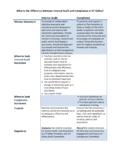
What is the Difference between Internal Audit and ...
www.utdallas.eduWhat is the Difference between Internal Audit and Compliance at UT Dallas? Internal Audit Compliance Mission Statement . To provide an independent,
OPRE 7310 Probability and Stochastic Processes - …
www.utdallas.eduOPRE 7310 Probability and Stochastic Processes - Syllabus Course Information Course number - section: OPRE 7310 - 001; Course title - term: Probability and Stochastic Processes - Fall 2017.
C/C++ Basics
www.utdallas.eduC/C++ Basics. Basic Concepts • Basic functions of each language: Input, output, math, decision, repetition

Chemical and Hazardous Materials Safety
www.utdallas.eduChemical and Hazardous Materials Safety Department of Environmental Health and Safety 800 West Campbell Rd., SG10 Richardson, TX 75080-3021 Phone 972-883-2381/4111 Fax 972-883-6115
Related documents

USING EXCEL SOLVER IN OPTIMIZATION PROBLEMS
archives.math.utk.eduwe demonstrate how to use Excel spreadsheet modeling and Solver to find the optimal solution of optimization problems. If the model has two variables, the graphical method can …
RESAMPLING USING EXCEL IN TEACHING STATISTICS
archives.math.utk.edu3. Sampling Distribution Using Excel Data Table Now we use Excel Data Table to generate the sampling distribution of mean and introduce the concepts.
Formulas & Functions in Microsoft Excel
biostat.mc.vanderbilt.eduExcel is a great tool to use for data collection and entry, and even to use for some derivation of other columns. However, Excel IS NOT the best tool to use to conduct advanced analyses, especially statistical analyses.

How to Use Excel for Data Entry - University of California ...
eds-courses.ucsd.eduExcel is a very popular tool for entering and manipulating data. This document shows you how to enter data that you can easily open in statistics packages such as SPSS or SAS.
Time Value of money using Excel - KFUPM
faculty.kfupm.edu.saTime Value of money using Excel Future Value calculations 1- Open Excel 2- Go to (Insert) tap 3- Choose (Function) 2 4- In the (insert function) box ... When the function argument box open, use the cell selector button to choose the relevant variables. 20 For cash …
Using Excel to Solve Business Problems - AI Applications
vaultanalytics.comPreparing to Use Excel 2007 Excel 2007 is used in the specific ‘How To’ sections, as it is the most ubiquitous piece of software with statistical capabilities.

Creating a Gradebook in Excel
eds-courses.ucsd.eduCreating a Gradebook in Excel Spreadsheets are a great tool for creating gradebooks. With a little bit of work, you can create a customized gradebook that will provide weighted scores and averages. The following instructions describe the steps for creating a spreadsheet gradebook.
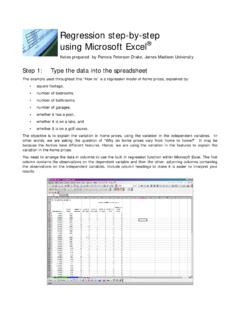
Regression step-by-step using Microsoft Excel
educ.jmu.eduStep 2: Use Excel®’s Data Analysis program, Regression In the Tools menu, you will find a Data Analysis option.1 Within Data Analysis, you should then choose Regression: Step 3: Specify the regression data and output You will see a pop-up box for the regression specifications.
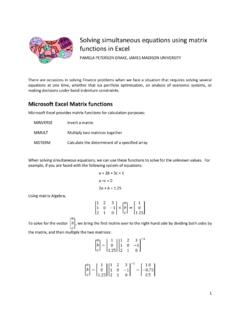
Solving simultaneous equations using matrix functions in Excel
educ.jmu.eduMicrosoft Excel provides matrix functions for calculation purposes: MINVERSE Invert a matrix MMULT Multiply two matrices together MDTERM Calculate the determinant of a specified array When solving simultaneous equations, we can use these functions to solve for the unknown values. For

Using Excel to Graph a Function - San Dieguito Union High ...
math.sduhsd.netUsing Excel to Graph a Function 1. Make the x-values. a. Type x in cell A1. b. Type 1 in cell A2 and type 2 in cell A3. c. Select cells A2 and A3 by clicking-and-dragging. Select the “formula drag” point in the lower right corner of the selection and drag this down until you have the values 1 through 15 showing.
Related search queries
USING EXCEL SOLVER IN OPTIMIZATION PROBLEMS, How to use Excel, RESAMPLING USING EXCEL IN TEACHING STATISTICS, Excel, Use Excel, Formulas & Functions in Microsoft Excel, How to Use Excel for Data Entry, Using Excel to Solve Business Problems, Creating a Gradebook in Excel, Using Excel to Graph a Function