Example: quiz answers
Graphical Analysis 3
The first step in using Graphical Analysis is usually entering a table of data. Most data tables will have two “manually entered” columns. The blank data table to the right has been set up so that Time (X-axis) and Pressure (Y-axis) can be manually entered into the first two columns. To enter the time and pressure data, simply click a cell ...
Tags:
Information
Domain:
Source:
Link to this page:
Documents from same domain
7 Acid-Base Titration Computer
www2.vernier.comComputer 7 Advanced Chemistry with Vernier 7 - 1 Acid-Base Titration A titration is a process used to determine the volume of a solution that is needed to react with a
25 Titration Diprotic Acid - Vernier Software & …
www2.vernier.comTitration of a Diprotic Acid: Identifying an Unknown Chemistry with Vernier 25 - 3 5. Obtain approximately 60 mL of ~0.1 M NaOH solution in a 250 mL beaker.

Computer 13 Calcium and Water Hardness
www2.vernier.comComputer 13 13 - 2 Water Quality with Vernier Note that 30 mg/L Ca2+ and 75 mg/L calcium hardness as CaCO 3 are equivalent—they are simply two different ways of expressing calcium levels.
Test 14 Total Hardness - Vernier Software & …
www2.vernier.comComputer 14 14 - 2 Water Quality with Vernier Table 1: Ca Hardness, Mg Hardness, and Total Hardness in Selected Sites Site (fall season) Ca hardness (mg/L as CaCO3) Mg hardness
30 Rate Crystal Violet
www2.vernier.comComputer 30 Chemistry with Vernier 30 - 1 Rate Law Determination of the Crystal Violet Reaction In this experiment, you will observe the reaction between crystal violet and sodium hydroxide.
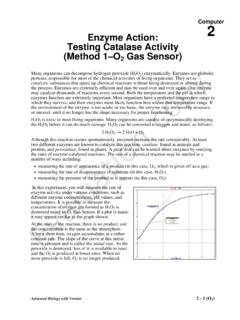
Enzyme Action: Testing Catalase Activity (Method …
www2.vernier.comComputer 2 Advanced Biology with Vernier 2 - 1 (O 2) Enzyme Action: Testing Catalase Activity (Method 1–O 2 Gas Sensor) Many organisms can decompose hydrogen peroxide (H
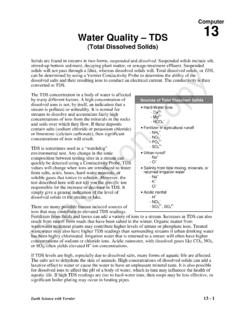
(Total Dissolved Solids)
www2.vernier.comComputer 13 Earth Science with Vernier 13 - 1 Water Quality – TDS (Total Dissolved Solids) Solids are found in streams in two forms, suspended and …

Computer 12 Effect of Temperature on Solubility …
www2.vernier.comComputer 12 Chemistry with Vernier 12 - 1 Effect of Temperature on Solubility of a Salt In this experiment, you will study the effect of changing temperature on the amount of …

12A Yeast Respiration CO2
www2.vernier.comComputer 12A Biology with Vernier 12A - 1 Respiration of Sugars by Yeast Yeast are able to metabolize some foods, but not others. In order for an organism to make use of
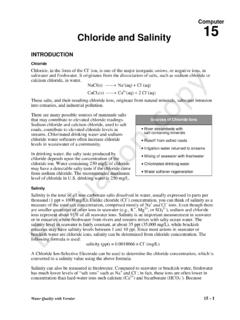
Test 15 Cl and Salinity - Vernier Software & …
www2.vernier.comComputer 15 15 - 2 Water Quality with Vernier salinity readings in freshwater will be significantly lower than in seawater or brackish water, readings are often expressed in mg/L instead of ppt (1 ppt = 1000 mg/L).
Related documents
Advanced Excel: Pivot Tables - Elmhurst Public Library
elmhurstpubliclibrary.orgarrangement of the data so that it can be seen from multiple perspectives. It is, Advanced Excel: Pivot Tables ... What you’re looking at now is a pivot table that is displaying no data. To add ... feature allows you to see many of the possible pivot tables your data can. 8 generate.
Displaying Data from Multiple Tables - Başkent Üniversitesi
www.baskent.edu.trObtaining Data from Multiple Tables SELECT e.empno, e.deptno, d.loc FROM emp e, dept d WHERE e.deptno = d.deptno; Data from Multiple Tables Sometimes you need to use data from more than one table. In the slide example, the report displays data from two separate tables. •EMPNO exists in the EMP table •DEPTNO exists in both the EMP and DEPT ...

Displaying Data from Multiple Tables - Başkent Üniversitesi
www.baskent.edu.trDisplaying Data from Multiple Tables . 2 Objectives After completing this lesson, you should be able to do the following: • Write SELECT statements to access data from more than one table using eguality and nonequality joins • View data that generally does not meet a
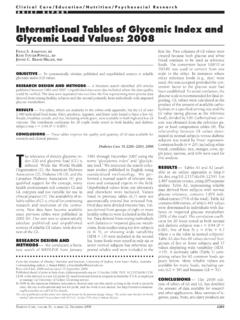
International Tables of Glycemic Index and Glycemic Load ...
care.diabetesjournals.orgvalues displaying wide variability (SEM 15). A summary table (Table 1) com-prising values for 62 common foods ap-pears below. More reliable values are available for many foods, including car-rots (GI 39) and bananas (GI 51). CONCLUSIONS— The 2008 edi-tion of tables of GI and GL has doubled the amount of data available for research

Introduction to PANalytical X’Pert HighScore Plus v3.0 ...
prism.mit.eduII. Displaying Data and Basic Manipulation a. Opening Data pg 4 b. Zooming In/Out pg 4 c. Comparing Multiple Scans pg 5 III. Opening a PDF Reference Pattern a. Retrieving a Card by Reference Code pg 6 b. Searching for a Reference Pattern pg 6-9 i. Using Chemistry as search parameters pg 7 ii.
SPSS Step-by-Step Tutorial: Part 1 - DataStep
www.datastep.comThe data view displays your actual data and any new variables you have created (we’ll discuss creating new variables later on in this session). 1. From the menu, select File > Open > Data. 2. In the Open File window, navigate to C:\SPSSTutorialData\Employee data.sav and open it by double-clicking. SPSS opens a window that looks like a standard

SAP Analytics Cloud Integrating with SAP BW - Best Practices
blog.asug.comand tables without scripting –Use Powerful visualizations not available in on-premise clients, e.g. time-series charts, in-line charts in tables (sparklines) Powerful options to enrich BW Query data, e.g. –Blending of live BW Query data with local / acquired data –Restricted Measure calculations on …

ARCHITECTING MICROSOFT SQL SERVER ON VMWARE …
www.vmware.comServer installations ranging from large data warehouses with business intelligence and reporting features to small, highly specialized departmental and application databases. The flexibility at the database layer translates directly into application flexibility, giving end users more useful application features and ultimately improving ...

Useful Stata Commands 2019
homepages.rpi.eduedit Opens the data editor, to type in or paste data. You must close the data editor before you can run any further commands. use "filename.dta" Reads in a Stata-format data file. insheet delimited "filename.txt" Reads in text data (allowing for various text encodings), in Stata 14 or newer.
Stata: Visualizing Regression Models Using coefplot
opr.princeton.eduStata: Visualizing Regression Models Using coefplot Partiallybased on Ben Jann’s June 2014 presentation at the 12thGerman Stata Users Group meeting in Hamburg, Germany: “A new command for plotting regression coefficients and other estimates”