Example: barber
International Population Reports - Census
Figure 2-1. Percentage of Population Aged 65 and Over: 2015 and 2050 ..... 4 Figure 2-2. World Population by Age Group: 2015 to 2050 ..... . . . . . . 5 Figure 2-3. Young Children and Older People as a Percentage of Global Population: 1950 to 2050 .... 5 Figure 2-4. Population Aged 65 and Over by Region: 2015 to 2050 ..... . . . . . . 8
Tags:
Information
Domain:
Source:
Link to this page:
Documents from same domain
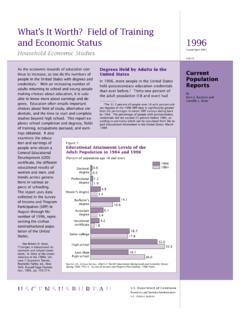
What's It Worth? Field of Training and Economic …
www.census.gov2. U.S. Census Bureau. degrees or certificates above the high school level in 1996, up from 21 percent in 1984, the first year covered by a report from this series
Overview of Administrative Data Matching to …
www.census.govOverview of Administrative Data Matching to Postsecondary Studies at ... Internal Revenue Service ... (Education Testing Service, Prometric, College
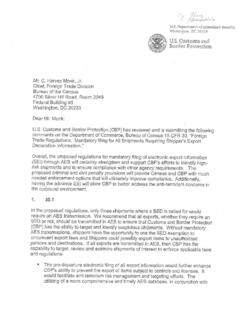
US Customs and Border Protection - Census
www.census.govCustoms and Border Protection . ATS-AT would allow for the development of additional targeting tools to better establish risk and conduct more effective outbound ...

Median and Average Square Feet of Floor Area in ... …
www.census.govRegion Region United Inside Outside North- United Inside Outside North-Year States MSAs MSAs east Midwest South West States MSAs MSAs east Midwest South West
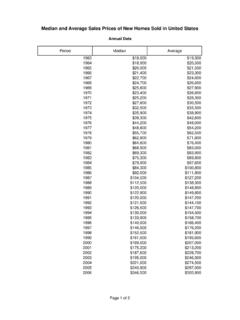
Median and Average Sales Prices of New Homes ... …
www.census.govPeriod Median Average Median and Average Sales Prices of New Homes Sold in United States Annual Data 2007 $247,900 $313,600 2008 $232,100 $292,600
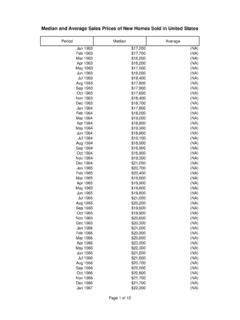
Median and Average Sales Prices of New Homes …
www.census.govPeriod Median Average Median and Average Sales Prices of New Homes Sold in United States Mar 1971 $24,300 (NA) Apr 1971 $25,800 (NA) May 1971 $25,500 (NA)
MEASURING THE DIGITAL ECONOMY - Census.gov
www.census.goveconomy was a critical first step in developing useful statistics about it. During the Summer 1999, the Census Bureau developed definitions and concepts to describe the digital economy.
Language Use and English-Speaking Ability: 2000
www.census.govThe ability to commu-nicate with govern-ment and private serv-ice providers, schools, businesses, emergency personnel, and many other people in the
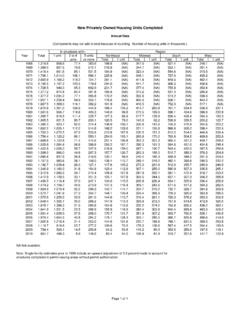
New Privately Owned Housing Units Completed - Census.gov
www.census.govNew Privately Owned Housing Units Completed Annual Data (Components may not add to total because of rounding. Number of housing units in thousands.)
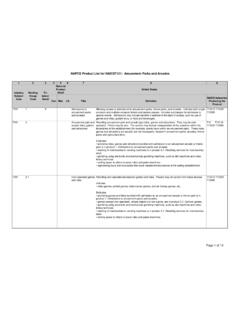
NAPCS Product List for NAICS7131: Amusement Parks and …
www.census.govpark is in product 1, Admissions to amusement parks and arcades. • renting space to others to place rides and game machines. • sightseeing tours and excursions that travel outside the boundaries of the selling establishment.
Related documents

Ethnicity, deprivation and educational achievement at age ...
assets.publishing.service.gov.ukFigure 15: Percentage of students age 5-16 entitled to a FSM: England 2011 51 Figure 16: Percentage of students in each of five score bands based on IDACI: England 2011 51 Figure 17: GCSE results at age 16 adjusted for Socio-economic Status (SES) 52 Figure 18: Age 16 5EM results by ethnic group and FSM: England 2013 53

POPULATION COMPOSITION
censusindia.gov.in2.3 This chapter provides data on percentage distribution of population by age, sex and residence for all broad age groups from 0-4, 0-14, 15-59 and 60+ for India and bigger States. It also includes data on percentage distribution of population by marital status for total population, 10+ and 15+ ages by sex and residence.

Persons with a Disability: Labor Force Characteristics - 2021
www.bls.govwithout a disability, at 63.7 percent in 2021, increased by 1.9 percentage points over the year but was 2.6 percentage points lower than in 2019. The lower ratio among persons with a disability reflects, in part, the older age profile of persons with a disability; older workers are less likely to be employed, regardless of disability status.
Union Members - 2021 - Bureau of Labor Statistics
www.bls.govmembership rate declined by 0.9 percentage point in 2021 to 33.9 percent, following an increase of 1.2 percentage points in 2020. In 2021, the union membership rate continued to be highest in local government (40.2 percent), which employs many workers in heavily unionized occupations, such as police officers, firefighters, and teachers.
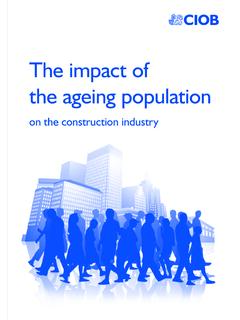
The Chartered Institute of Building The impact of - CIOB
www.ciob.orgcurrently 3.3 people of working age to each person above state pension age, but this figure is expected to drop to 2.9 in 20323. One way to meet this challenge would be to extend the retirement age and keep more people in work. This is already being done, by equalising the retirement age of men and women at 65. There is also a plan to increase
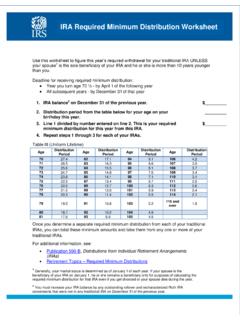
IRA Required Minimum Distribution Worksheet
www.irs.govof the following year Year you turn age 70 ½ - by April 1 of that yearAll subsequent years - by December 31. 1. 2IRA balance on December 31 of the previous year. $_____ 2. Distribution period from the table below for your age on your birthday this year. _____ 3. Line 1 divided by number entered on line 2. This is your required

THE FACTS OF LIFE SENTENCES - Sentencing Project
www.sentencingproject.org“age out” of criminal behavior, and their continued incarceration diminishes returns on public safety. This is both wasteful and inhumane. To provide a better approach to advancing public safety, sentencing policies in the United States should be capped at a maximum of 20 years in prison, except in circumstances in which the