Transcription of Introduction to Gas Phase FTIR Spectroscopy
1 Introduction to Gas Phase ftir Spectroscopy22 ftir stands for Fourier transform infrared, the preferred method of infrared Spectroscopy . In infrared (IR) Spectroscopy , radiation in the IR region of the electromagnetic spectrum is passed through a gas sample. Some of the infrared radiation is absorbed by the sample and some of it is passed through (transmitted). The resulting spectrum represents the molecular absorption and transmission response, creating a molecular fingerprint of the sample. Like a fingerprint no two unique molecular structures produce the same infrared spectrum .
2 This makes infrared Spectroscopy useful for several types of , what information can ftir Spectroscopy provide? It can identify trace contaminants in high-purity gas samples It can determine up to 30 components in gases from combustion processes, such as diesel engine emissions or continuous emissions monitoring (CEM) applications It can quantify gas samples over large concentration spans, from parts per billion up to It can monitor gas samples continuously, providing Concentration versus Time trend charts It cannot detect diatomic or noble gases such as O2, N2, H2, He, or Ar, which do not have absorbance bands in the infrared region of the booklet is an Introduction to the principles behind ftir gas Spectroscopy and will address basic ftir theory, how it works, and the practical aspects that must be considered for ftir analysis of gases.
3 We hope that this information gives you a good understanding of the importance and usefulness of this powerful to ftir spectroscopyThe SpectrometerConceptual diagram of the beam path through a transmission sample23 Why infrared Spectroscopy ?Infrared Spectroscopy has been a workhorse technique for materials analysis in the laboratory for over seventy years. An infrared spectrum represents a fingerprint of a sample with absorption peaks that correspond to the frequencies of vibrations between the bonds of the atoms making up the material. As each chemical compound is comprised of a unique combination of atoms, no two compounds produce the exact same infrared spectrum .
4 Therefore, infrared Spectroscopy can result in a positive identification (qualitative analysis) of a material s unique composition. In addition, the size of the peaks in the infrared spectrum is a direct indication of the amount of material present. With modern software algorithms, infrared Spectroscopy is an excellent tool for quantitative Phase infrared spectroscopyA key advantage of infrared Spectroscopy is the simultaneous measurement of many frequencies within a single scan. This broad spectrum approach provides information for many types of chemical bonds, as the different IR frequencies cause vibration/rotation of different molecules at different energy levels.
5 For example, a C=C double bond is stronger and stiffer than a C-C single bond, so higher energy input, or higher frequency, is needed to cause a vibration. Similarly, an H-Cl bond will vibrate at a different frequency than an N-O bond. The infrared detector measures the amount of energy at each frequency that has passed through the sample. This results in a spectrum , which is a plot of absorbance intensity versus transform infrared Spectroscopy is preferred over older IR filter instruments or other gas analyzers for several reasons: It is a non-destructive technique with little or no sample preparation requirement It can quantify multiple components across a broad concentration range within a single measurement It provides a precise measurement method with extremely stable calibrations (no need for daily recalibration)
6 Can monitor high-speed transient responses as quickly as 5 scans/second Its sensitivity can be improved by co-adding repeated scans, providing detection limits down into part-per-billion for many componentsFTIR Spectroscopy for gas analysisSpectra of Common GasesFull- spectrum ftir analysis has the power to monitor multiple components in a single sample4A key advantage of ftir Spectroscopy is the measurement of all spectral frequencies simultaneously. Older IR technology used dispersion gratings, which scan through the spectrum one frequency at a time.
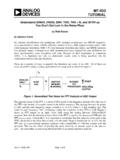
7 An ftir spectrometer uses an optical device called an interferometer, which modulates all of the infrared frequencies encoded into it. The signal can be measured very quickly, up to 5 scans a second for gas samples. This enables the spectrometer to monitor rapid changes in sample concentration over time. Most interferometers employ a beamsplitter, which takes the incoming infrared beam and divides it into two optical beams. One beam reflects off of a flat mirror that is fixed in place. The other beam reflects off of a flat mirror mounted on a mechanism that moves the mirror a very short distance (typically a few millimeters) away from the beamsplitter.
8 The two beams reflect off of their respective mirrors and are recombined when they meet back at the beamsplitter. Because the path that one beam travels is a fixed length and the other is constantly changing as its mirror moves, the signal that exits the interferometer is the result of these two beams interfering with each other. The resulting signal is called an interferogram, which has the unique property that every data point (a function of the moving mirror position) has information about every infrared frequency that comes from the source.
9 This means that as the interferogram is measured, all frequencies are being measured simultaneously. Thus, the use of the interferometer results in extremely fast measurements. Spectral resolution, the ability to discriminate between adjacent absorbance peaks, is important in gas analysis to help distinguish between different components. Gas spectra typically feature numerous sharp, narrow absorbance bands in a spectral envelope , as compared to the broader, rounder spectral bands characteristic of solid or liquid samples. This arises from gas molecules having more degrees of freedom from intermolecular effects, enabling the atoms in the chemical bonds to rotate and vibrate freely.
10 Consequently, spectrometers must be set to collect high-resolution data (typically cm-1) to resolve each sharp peak of a gas spectrum . Because the analyst requires a frequency spectrum (a plot of the intensity at each individual frequency) in order to make an identification, the measured interferogram signal cannot be interpreted directly. A means of decoding the individual frequencies is required. This can be accomplished via a well-known mathematical technique called the Fourier transformation (FT). This transformation is performed by the computer, which then presents the user with the desired spectral information for beamTransmittanceRatioBackgroundSampleBa ckgroundSampleAbsorbanceHow ftir Spectroscopy worksFTIR data processing summaryCAUTIONI nterferometerIR sourceMirrorMirrorMirrorMirrorBeamsplitt erOptical pathDetectorReference laserGas sample cellGenerating a spectrum on an ftir spectrometer follows this process: 1.