Transcription of Introduction to LabVIEW - National Tsing Hua …
1 Introduction to LabVIEWLabVIEW Laboratory Virtual Instrument Engineering Workbench First released by National Instruments in 1986, this graphical programming languageis now the standard software for data acquisition (DAQ)and instrument controlIntroduction LabVIEW programs are called virtual instruments, or VIs, because their appearance and operation imitate physical instruments, such as oscilloscopes and multimeters LabVIEW contains a comprehensive set of toolsfor acquiring, analyzing, displaying, and storingdata, as well as tools to help you troubleshoot code you writeThe NI Approach Integrated Hardware PlatformsHigh-SpeedDigitizersHigh-Resolu tionDigitizers and DMMsMultifunction Data AcquisitionDynamicSignal AcquisitionDigital I/OInstrumentControlCounter/TimersMachin eVisionMotion ControlDistributed I/O andEmbedded ControlLaptop PCPDAD esktop PCPXI Modular InstrumentationSignal Conditioningand SwitchingUnit Under TestWhat type of device should I use?
2 Xxx TriggeringxAC/DC2 416 80 14 18 bit250 K Ms/sNI PCI DAQsomexxPortable20 kS/s 2 GS/s10 200 KS/s8 44 KS/sAI BandwidthxAC/DC0212 24 bitInstruments*xAC/DC1 28 1612 16 bitNI USB DAQ CalibratedACAC or DC2AO Channels2AI Channels12 16 bitAccuracySound Card** The above table may not be representative of all device variations that exist in each categorySetting Up Hardware Data Acquisition Device (DAQ) Actual USB, PCI, or PXI Device Configured in MAX Simulated Data Acquisition Device (DAQ) Software simulated at the driver level Configured in MAX Sound Card Built into most computersWhat is MAX? MAX stands for Measurement & Automation Explorer. MAX configures and organizes all your National Instruments DAQ, PCI/PXI instruments, GPIB, IMAQ, IVI, Motion, VISA, and VXI devices. Used for configuring and testing Found onIcon Found onWindows DesktopWindows DesktopSetting Up Hardware Use Windows to: Verify a Sound CardUn-Mute MicrophoneSetting Up Hardware Use Measurement and Automation Explorer (MAX) to: Configure and test your Data Acquisition (DAQ) deviceIntroduction In LabVIEW , you build a user interface, or front panel, with controlsand indicators Controls are knobs, push buttons, dials, and other inputmechanisms.
3 Indicators are graphs, LEDs, and other outputdisplays After you build the user interface, you add code using VIsand structuresto control the front panel objects The block diagramcontains this codeEach VI has 2 WindowsFront Panel User Interface (UI) Controls = Inputs Indicators = OutputsBlock Diagram Graphical Code Data travels on wiresfrom controlsthrough functionsto indicators Blocks execute by DataflowLabVIEW Programs Are Called Virtual Instruments (VIs)Controls Palette(Controls & Indicators)(Place items on the Front Panel Window)Indicator:Numeric SlideControl:NumericCustomize Palette ViewWhat Types of Controls and Indicators are Available? Numeric Data Number input and display Analog Sliders, Dials, and Gauges Boolean Data Buttons and LEDs Array & Matrix Data Numeric Display Chart Graph XY Graph Intensity Graph 3D graph: point, surface, and model Decorations Tab Control Arrows Other Strings and text boxes Picture/Image Display ActiveX ControlsExpress Controls PaletteFunctions (and Structures) Palette(Place items on theBlock Diagram Window)Structure:While LoopWhat Types of Functions are Available?
4 Input and Output Signal and Data Simulation Acquire and Generate Real Signals with DAQ Instrument I/O Assistant (Serial & GPIB) ActiveX for communication with other programs Analysis Signal Processing Statistics Advanced Math and Formulas Continuous Time Solver Storage File I/OExpress Functions Palette Block diagram execution Dependent on the flow of data Block diagram does NOT execute left to right Node executes when data is available to ALL inputterminals Nodes supply data to all outputterminals when doneDataflow ProgrammingElements of Typical ProgramsA. Loops While Loop For LoopB. Functions and SubVIs Types of Functions Creating Custom Functions (SubVI) Functions Palette & SearchingC. Decision Making and File I/O Case Structure Select (simple If statement) File I/OLoops While Loops iterminal counts iteration Always runs at least once Runs until stop condition is met For Loops iterminal counts iterations Run according to input Nof count terminalWhile LoopWhile LoopFor LoopFor LoopDrawing a Loop1.
5 Select the structure2. Enclose code to be repeated3. Drop or drag additional nodes and then wire3 Types of Functions (from the Functions Palette)Express VIs: interactive VIs with configurable dialog page (blue border)Standard VIs: modularized VIs customized by wiring(customizable)Functions:fundamenta l operating elements of LabVIEW ; no front panel or block diagram (yellow)How Do I Make Decisions in LabVIEW ?1. Case Structures2. Select(a)(b)(c)Presenting your ResultsA. Displaying Data on the Front Panel Controls and Indicators Graphs and Charts Loop TimingB. Signal Processing MathScript Arrays Clusters WaveformsCharts Add 1 data point at a time with historyWaveform chart special numeric indicator that can display a history of values Chart updates with each individual point it receivesFunctions Express Graph Indicators ChartGraphs Display many data points at onceWaveform graph special numeric indicator that displays an array of data Graph updates after all points have been collected May be used in a loop if VI collects buffers of dataFunctions Express Graph Indicators Graph Loops can accumulate arrays at their boundaries with auto-indexing For Loops auto-index by default While Loops output only the final value by default Right-click tunnel and enable/disable auto-indexingBuilding Arrays with Loops (Auto-Indexing)Wire becomes thickerWire remains the same sizeAuto-Indexing DisabledAuto-Indexing EnabledOnly one value (last iteration)
6 Is passed out of the loop1D Array0 1 2 3 4 55 How Do I Time a Loop?1. Loop Time Delay Configure the Time Delay Express VI for seconds to wait each iteration of the loop (works on For and While loops).2. Timed Loops Configure special timed While loop for desired LoopTime DelayTextual Math in LabVIEW Integrate existing scripts with LabVIEW for faster development Interactive, easy-to-use, hands-on learning environment Develop algorithms, explore mathematical concepts, and analyze results using a single environment Freedom to choose the most effective syntax, whether graphical or textual within one VISupported Math Tools:MathScript script nodeMathSoft softwareMathematica softwareMATLAB softwareMaple softwareXmath softwareMATLAB is a registered trademark of The MathWorks, (MATrix LABoratory) The goal of MATLAB is to enable the users to solve a wide spectrum of analytical and numerical problems using matrix-based methods, attain excellent interfacing and interactive capabilities, provide easy access to and straightforward implementation of state-of-the-art numerical algorithms, guarantee powerful graphical features, etc.
7 Due to high flexibility and versatility, MATLAB has evolved over the last 20 years and become one of the most useful tools for scientific and engineering calculations and computingIntroduction to Clusters Data structure that groups data together Data may be of different types Analogous to structin C Elements must be either all controls or all indicators Thought of as wires bundled into a cable Order is importantReview of Data Types Found in LabVIEWM odularity in LabVIEW SubVIs Convert repeated functions and VIs with a single VICreate SubVI Enclose area to be converted into a subVI. Select Edit Create SubVIfrom the Edit ControlA. Overview of Instrument ControlB. GPIBC. SerialD. Instrument I/O AssistantE. VISAF. Instrument Drivers and IDNETLabVIEWTMG etting Started with LabVIEWG etting Started with LabVIEWA ugust 2006373427B-01 National Instruments Corporation1-1 Getting Started with LabVIEW1 Getting Started with LabVIEW Virtual InstrumentsLabVIEW programs are called virtual instruments, or VIs, because their appearance and operation imitate physical instruments, such as oscilloscopes and multimeters.
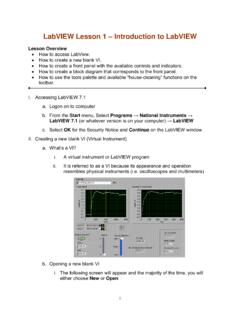
8 LabVIEW contains a comprehensive set of tools for acquiring, analyzing, displaying, and storing data, as well as tools to help you troubleshoot code you LabVIEW , you build a user interface, or front panel, with controls and indicators. Controls are knobs, push buttons, dials, and other input mechanisms. Indicators are graphs, LEDs, and other output displays. After you build the user interface, you add code using VIs and structures to control the front panel objects. The block diagram contains this can use LabVIEW to communicate with hardware such as data acquisition, vision, and motion control devices, as well as GPIB, PXI, VXI, RS232, and RS485 a Virtual InstrumentIn the following exercises, you will build a VI that generates a signal and displays that signal in a graph. After you complete the exercises, the front panel of the VI will look similar to the front panel in Figure can complete the exercises in this chapter in approximately 40 1 Getting Started with LabVIEW Virtual InstrumentsGetting Started with 1-1.
9 Front Panel of the Acquiring a Signal VILaunching LabVIEWThe Getting Started window, shown in Figure 1-2, appears when you launch LabVIEW . Use this window to create new VIs, select among the most recently opened LabVIEW files, find examples, and launch the LabVIEW Help. You also can access information and resources to help you learn about LabVIEW , such as specific manuals, help topics, and resources on the National Instruments Web site, 1 Getting Started with LabVIEW Virtual Instruments National Instruments Corporation1-3 Getting Started with LabVIEWF igure 1-2. Getting Started WindowThe Getting Started window disappears when you open an existing file or create a new file. The Getting Started window reappears when you close all open front panels and block diagrams. You also can display the window from the front panel or block diagram by selecting View Getting Started a New VI from a TemplateLabVIEW provides built-in template VIs that include the subVIs, functions, structures, and front panel objects you need to get started building common measurement the following steps to create a VI that generates a signal and displays it on the front 1 Getting Started with LabVIEW Virtual InstrumentsGetting Started with the Getting Started window, click the New or VI from Template link to display the New dialog the Create New list, select VI From Template Tutorial (Getting Started) Generate and Display.
10 This template VI generates and displays a preview and a brief description of the template VI appear in the Description section. Figure 1-3 shows the New dialog box and the preview of the Generate and Display template VI. Figure 1-3. New Dialog the OK button to create a VI from the template. You also can double-click the name of the template VI in the Create New list to create a VI from a 1 Getting Started with LabVIEW Virtual Instruments National Instruments Corporation1-5 Getting Started with the front panel of the user interface, or front panel, appears with a gray background and includes controls and indicators. The title bar of the front panel indicates that this window is the front panel for the Generate and Display the front panel is not visible, you can display the front panel by selecting Window Show Front Panel. You also can switch between the front panel window and block diagram window at any time by pressing the <Ctrl-E> keys.