Transcription of Introduction to Structural-Equation Models
1 Sociology 761 John Fox Lecture Notes Introduction to Structural-Equation Models Copyright 2014 by John Fox Introduction to Structural-Equation Models11. IntroductionIStructural-equation Models (SEMs) are multiple-equation regressionmodels in which the response variable in one regression equation canappear as an explanatory variable in another equation. Two variables in a SEM can even effect one-another reciprocally, eitherdirectly, or indirectly through a feedback Models can include variables that are not measureddirectly, but rather indirectly through their effects (calledindicators)or,sometimes, through their observable causes. Unmeasured variables are variously termedlatent variables,con-structs, Structural-Equation methods represent a confluence of work inmany disciplines, including biostatistics, econometrics, psychometrics,and social statistics. The general synthesis of these various traditionsdates to the late 1960s and early 761 Copyrightc 2014 by John FoxIntroduction to Structural-Equation Models2 IThis Introduction to SEMs takes up several topics: The form and specification of observed-variables SEMs.
2 Instrumental variables estimation. The identification problem : Determining whether or not a SEM, oncespecified, can be estimated. Estimation of observed-variable SEMs. Structural-Equation Models with latent variables, measurement errors,and multiple will estimate SEMs using thesempackage in 761 Copyrightc 2014 by John FoxIntroduction to Structural-Equation Models32. Specification of structural -EquationModelsIStructural-equ ation Models are multiple-equation regression modelsrepresenting putative causal (and hencestructural) relationships amonga number of variables, some of which may affect one another mutually. Claiming that a relationship is causal based on observational data isno less problematic in a SEM than it is in a single-equation regressionmodel. Such a claim is intrinsically problematic and requires support beyondthe data at hand. SEMs,however,allowonetochecktheconsisten cyofaspecifiedmodel with the data and to estimate causal effectsassuming thecorrectnessof the 761 Copyrightc 2014 by John FoxIntroduction to Structural-Equation Models4 ISeveral classes of variables appears in SEMs: Endogenous variablesare the response variables of the model .
3 There is onestructural equation(regression equation) for eachendogenous variable. An endogenous variable may, however, also appear as an explana-tory variable in other structural equations . For the kinds of Models that we will consider, the endogenousvariables are (as in the single-equation linear model ) quantitativecontinuous variables. Exogenous variablesappear only as explanatory variables in thestructural equations . The values of exogenous variable are therefore determined outsideof the model (hence the term). Like the explanatory variables in a linear model , exogenous variablesare assumed to be measured without error (but see the laterdiscussion of latent-variable Models ).Sociology 761 Copyrightc 2014 by John FoxIntroduction to Structural-Equation Models5 Exogenous variables can be categorical (represented, as in a linearmodel, by dummy regressors or other sorts of contrasts). structural errors(ordisturbances) represent the aggregated omittedcauses of the endogenous variables, along with measurement error(and possibly intrinsic randomness) in the endogenous variables.
4 There is one error variable for each endogenous variable (and hencefor each structural equation). The errors are assumed to have zero expectations and to beindependent of (or at least uncorrelated with) the exogenousvariables. The errors for different observations are assumed to be independentof one another, but (depending upon the form of the model ) differenterrors for the same observation may be 761 Copyrightc 2014 by John FoxIntroduction to Structural-Equation Models6 Each error variable is assumed to have constant variance acrossobservations, although different error variables generally will havedifferent variances (and indeed different units of measurement the square units of the corresponding endogenous variables). As in linear Models , we will sometimes assume that the errors arenormally will use the following notation for writing down SEMs: Endogenous variables:|n>|n0 Exogenous variables:{m>{m0 Errors:%n>%n0 Sociology 761 Copyrightc 2014 by John FoxIntroduction to Structural-Equation Models7 structural coefficients( , regression coefficients) representing thedirect (partial) effect of an exogenous on an endogenous variable,{mon|n: nm(gamma).}}}
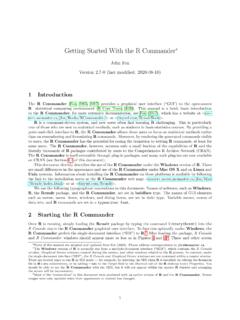
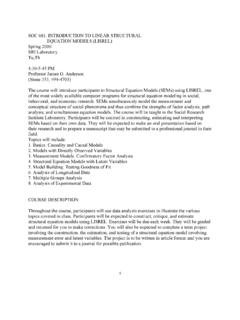
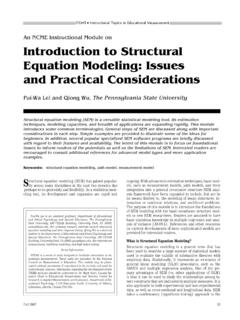
5 Note that the subscript of the response variable comesfirst. of an endogenous variable on another endogenous variable,|n0on|n: nn0(beta). Covariances between two exogenous variables,{mand{m0: mm0 two error variables,%nand%n0: nn0 When we require them, other covariances are represented similarly. Variances will be written either as 2mor as mm( , the covariance of avariable with itself), as is 761 Copyrightc 2014 by John FoxIntroduction to Structural-Equation Path DiagramsIAn intuitively appealing way of representing a SEM is in the form ofa causal graph, called a path diagram. An example, from Duncan,Haller, and Portes s (1968) study of peer influences on the aspirations ofhigh-school students, appears in Figure following conventions are used in the path diagram: A directed (single-headed) arrow represents a direct effect of onevariable on another; each such arrow is labelled with a structuralcoefficient. A bidirectional (two-headed) arrow represents a covariance, betweenexogenous variables or between errors, that is not given causalinterpretation.}}
6 Igiveeachvariableinthemodel({>|>and%) a unique subscript; Ifindthat this helps to keep track of variables and 761 Copyrightc 2014 by John FoxIntroduction to Structural-Equation Models9x1x2x3x4y5y6H7H8V78V14J51J52J63J6 4E56E65 Figure 1. Duncan, Haller, and Portes s (nonrecursive) peer-influencesmodel:{1, respondent s IQ;{2, respondent s family SES;{3, best friend sfamily SES;{4, best friend s IQ;|5, respondent s occupational aspiration;|6, best friend s occupational aspiration. So as not to clutter the diagram,only one exogenous covariance, 14, 761 Copyrightc 2014 by John FoxIntroduction to Structural-Equation Models10 IWhen two variables are not linked by a directed arrow itdoes notnecessarily mean that one does not affect the other: For example, in the Duncan, Haller, and Portes model , respondent sIQ ({1) can affect best friend s occupational aspiration (|6), but onlyindirectly, through respondent s aspiration (|5). The absence of a directed arrow between respondent s IQ and bestfriend s aspiration means that there is nopartial relationshipbetweenthe two variables when the direct causes of best friend s aspiration areheld constant.}}}}}}
7 In general, indirect effects can be identified with compound paths through the path diagram. The model can also account for non-causal sources of covariation. , part of the relationship between{1and|6isduetothecorrelation of{1with{4, which is a direct cause of| 761 Copyrightc 2014 by John FoxIntroduction to Structural-Equation structural EquationsIThe structural equations of a model can be read straightforwardly fromthepathdiagram. For example, for the Duncan, Haller, and Portes peer-influencesmodel:|5l= 50+ 51{1l+ 52{2l+ 56|6l+%7l|6l= 60+ 63{3l+ 64{4l+ 65|5l+%8l I ll usually simplify the structural equations by(i)suppressing the subscriptlfor observation;(ii)expressing all{sand|s as deviations from their populations means(and, later, from their means in the sample). Putting variables in mean-deviation form gets rid of the constant terms(here, 50and 60) from the structural equations (which are rarely ofinterest), and will simplify some algebra later 761 Copyrightc 2014 by John FoxIntroduction to Structural-Equation Models12 Applying these simplifications to the peer-influences model :|5= 51{1+ 52{2+ 56|6+%7|6= 63{3+ 64{4+ 65|5+%8 Sociology 761 Copyrightc 2014 by John FoxIntroduction to Structural-Equation Matrix Form of the ModelIIt is sometimes helpful ( , for generality) to cast a structural -equationmodel in matrix illustrate, I ll begin by rewriting the Duncan, Haller and Portes model ,shifting all observed variables ( , with the exception of the errors)to the left-hand side of the model , and showing all variables explicitly.}}}}}}}}}}}}
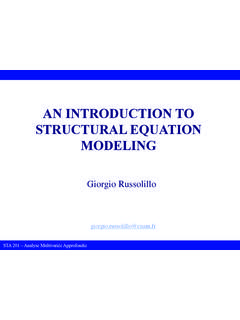
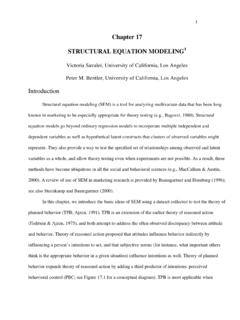
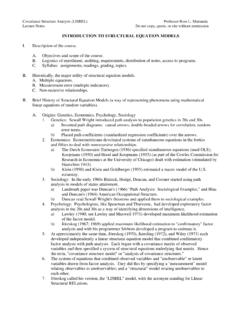
8 Variables missing from an equation therefore get0coefficients, while theresponse variable in each equation is shown with a coefficient of1:1|5 56|6 51{1 52{2+0{3+0{4=%7 65|5+1|6+0{1+0{2 63{3 64{4=%8 Sociology 761 Copyrightc 2014 by John FoxIntroduction to Structural-Equation Models14 ICollecting the endogenous variables, exogenous variables, errors, andcoefficients into vectors and matrices, we can write 1 56 651 |5|6 + 51 520000 63 64 5997{1{2{3{46::8= %7%8 IMore generally, where there aretendogenous variables (and henceterrors) andpexogenous variables, the model for an individualobservation isB(t t)yl(t 1)+K(t p)xl(p 1)=%l(t 1) TheBandKmatrices of structural coefficients typically contain some0elements, and the diagonal entries of theBmatrix are1s=Sociology 761 Copyrightc 2014 by John FoxIntroduction to Structural-Equation Models15 IWecanalsowritethemodelforallqobservatio ns in the sample:Y(q t)B0(t t)+X(q p)K0(p t)=E(q t) I have transposed the structural -coefficient matricesBandK,writingeach structural equation as a column (rather than as a row), so thateach observation comprises a row of the matricesY,X, andEofendogenous variables, exogenous variables, and 761 Copyrightc 2014 by John FoxIntroduction to Structural-Equation Recursive, Block-Recursive, and NonrecursiveStructural-Equation ModelsIAn important type of SEM, called arecursivemodel, has two definingcharacteristics:(a)Different error variables are independent (or, at least, uncorrelated).}}}}}}}}}}}}
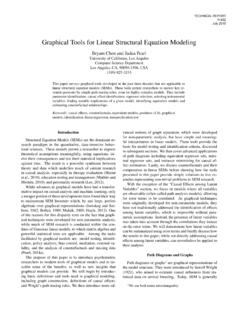
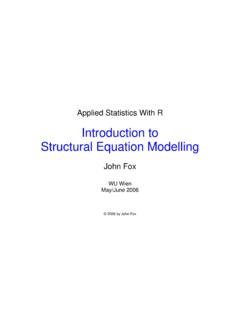
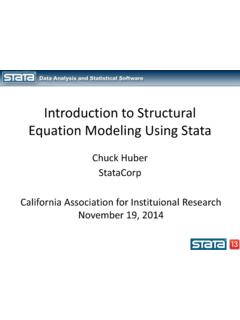
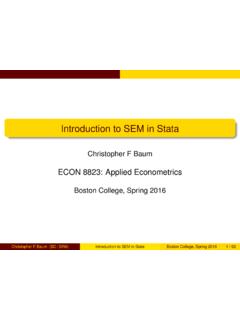
9 (b)Causation in the model is unidirectional: There are no reciprocalpaths or feedback loops, as shown in Figure another way, theBmatrix for a recursive SEM is lower-triangular,while the error-covariance matrixP%%is 761 Copyrightc 2014 by John FoxIntroduction to Structural-Equation Models17reciprocalpathsa feedbacklo opykyk ykyk yk Figure 2. Reciprocal paths and feedback loops cannot appear in a recur-sive 761 Copyrightc 2014 by John FoxIntroduction to Structural-Equation Models18 IAn illustrative recursive model , from Blau and Duncan s seminalmonograph,The American Occupational Structure(1967), appears inFigure 3. For the Blau and Duncan model :B=57100 4310 53 54168P%%=57 26000 27000 2868 ISometimes the requirements for unidirectional causation and indepen-dent errors are met by subsets ( blocks ) of endogenous variables andtheir associated errors rather than by the individual variables. Such amodel is calledblock illustrative block-recursive model for the Duncan, Haller, and Portespeer-influences data is shown in Figure 761 Copyrightc 2014 by John FoxIntroduction to Structural-Equation Models19x1x2y3y4y5H6H7H8V12J32J52J31J42E 43E53E54 Figure 3.
10 Blau and Duncan s basic stratification model :{1, father s edu-cation;{2, father s occupational status;|3, respondent s (son s) education;|4, respondent sfirst-job status;|5, respondent s present (1962) occupa-tional 761 Copyrightc 2014 by John FoxIntroduction to Structural-Equation Models20x1x2x3x4y5y6H9H10y7y8H11H12block 1block 2 Figure 4. An extended, block-recursive model for Duncan, Haller, andPortes s peer-influences data:{1, respondent s IQ;{2, respondent s familySES;{3, best friend s family SES;{4, best friend s IQ;|5, respondent soccupational aspiration;|6, best friend s occupational aspiration;|7,re-spondent s educational aspiration;|8, best friend s educational 761 Copyrightc 2014 by John FoxIntroduction to Structural-Equation Models21 HereB=59971 5600 65100 7501 780 86 8716::8= B110B21B22 P%%=5997 29 9>1000 10>9 2100000 211 11>1200 12>11 2126::8= P1100P22 IA model that is neither recursive nor block-recursive (such as the modelfor Duncan, Haller and Portes s data in Figure 1) is 761 Copyrightc 2014 by John FoxIntroduction to Structural-Equation Models223.}}}}}}