Transcription of Introduction to Ultraviolet - Visible Spectroscopy (UV)
1 UVVUVI ntroduction to Ultraviolet - Visible Spectroscopy1(UV) Background TheoryAbsorption of Ultraviolet and Visible radiationAbsorption of Visible and Ultraviolet (UV) radiation isassociated with excitation of electrons, in both atomsand molecules, from lower to higher energy levels. Since the energy levels of matter are quantized, only lightwith the precise amount of energy can cause transitionsfrom one level to another will be absorbed. The possible electronic transitions that light might cause are2:In each possible case, an electron is excited from a full(low energy, ground state) orbital into an empty (higher energy, excited state) anti-bonding Each wavelength of light has a particular energyassociated with it. If that particular amount of energy isjust right for making one of these electronic transitions,then that wavelength will be absorbed.
2 The larger the gap between the energy levels, the greaterthe energy required to promote the electron to the higherenergy level; resulting in light of higher frequency, and therefore shorter wavelength, being molecules will undergo electronic excitation followingabsorption of light, but for most molecules very highenergy radiation (in the vacuum Ultraviolet , <200 nm) isrequired. Consequently, absorption of light in the UV- Visible region will only result in the following transitions:Therefore in order to absorb light in the region from 200 - 800 nm (where spectra are measured), the moleculemust contain either Vbonds or atoms with non-bondingorbitals. A non-bonding orbital is a lone pair on, say,oxygen, nitrogen or a are formed by sideways overlap of the half-filled p orbitals on the two carbon atoms of a double bond.
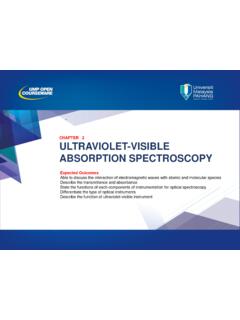
3 The two red shapes shown in the diagram below for ethene are part of the same Vbonding orbital. Both of the electrons are found in the resulting Vbondingorbital in the ground 2009 Royal Society of Chemistry known as UV- Visible further reading about bonding refer to #topRSC-BTL-946 SIAS S 8/7/09 11:45 Page 11 Molecules that contain conjugated systems, alternating single and double bonds, will have theirelectrons delocalised due to overlap of the p orbitals in thedouble bonds. This is illustrated below for buta-1, is a well-known example of a conjugatedsystem. The Kekul structure of benzene consists ofalternating single double bonds and these give rise to thedelocalised Vsystem above and below the plane of thecarbon carbon single the amount of delocalisation in the molecule increasesthe energy gap between the Vbonding orbitals and Vanti-bonding orbitals gets smaller and therefore light oflower energy, and longer wavelength, is buta-1,3-diene absorbs light of a longerwavelength than ethene it is still absorbing in the UVregion and hence both compounds are , if the delocalisation is extended further thewavelength absorbed will eventually be long enough tobe in the Visible region of the spectrum, resulting in ahighly coloured compound.
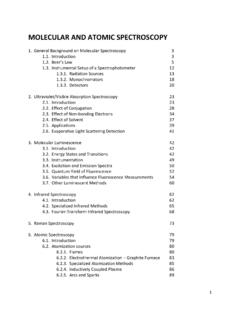
4 A good example of this is theorange plant pigment, beta-carotene which has 11 carbon-carbon double bonds conjugated absorbs throughout the UV region butparticularly strongly in the Visible region between 400 and 500 nm with a peak at 470 in a molecule which consist of alternating singleand double bonds (conjugation) and absorb Visible lightare known as metal complexesare also highly coloured,which is due to the splitting of the d orbitals when the ligands approach and bond to the central metal of the d orbitals gain energy and some loseenergy. The amount of splitting depends on the centralmetal ion and ligands. The difference in energy between the new levels affectshow much energy will be absorbed when an electron ispromoted to a higher level.
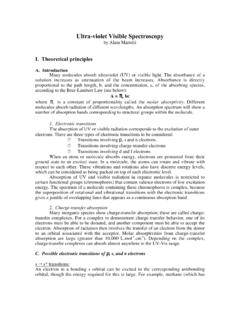
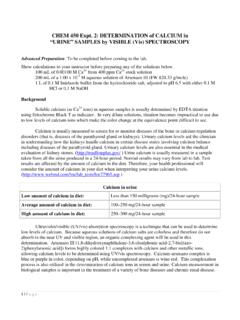
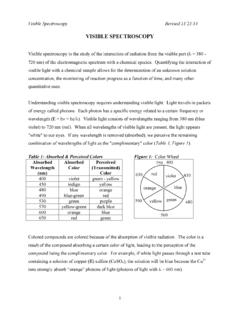
5 The amount of energy willgovern the colour of light which will be example, in the octahedralcopper complex, [Cu(H2O)6]2+, yellow light has sufficient energy topromote the d electron in the lowerenergy level to the higher 2009 Royal Society of Chemistry 2 Ultraviolet - Visible Spectroscopy (UV)RSC-BTL-946 SIAS S 8/7/09 11:45 Page 12It is possible to predict which wavelengths are likely to be absorbed by a coloured substance. When white lightpasses through or is reflected by a coloured substance, a characteristic portion of the mixed wavelengths isabsorbed. The remaining light will then assume thecomplementary colour to the wavelength(s) absorbed. This relationship is demonstrated by the colour wheelshown on the right.
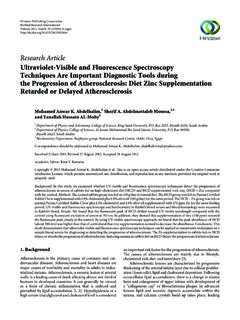
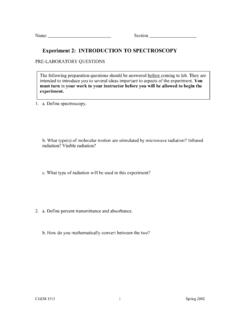
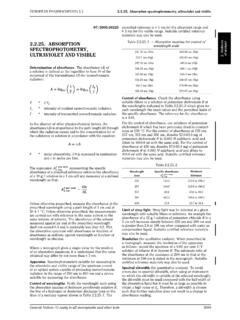
6 Complementary colours arediametrically opposite each other. UV- Visible spectrometers can be used to measure theabsorbance of ultra violet or Visible light by a sample,either at a single wavelength or perform a scan over arange in the spectrum. The UV region ranges from 190 to 400 nm and the Visible region from 400 to 800 nm. The technique can be used both quantitatively andqualitatively. A schematic diagram of a UV-visiblespectrometer is shown above. The light source (a combination of tungsten/halogen and deuterium lamps) provides the Visible and nearultraviolet radiation covering the 200 800 nm. The output from the light source is focused onto thediffraction grating which splits the incoming light into its component colours of different wavelengths, like a prism (shown below) but more liquids the sample is held in an optically flat, transparentcontainer called a cellor cuvette.
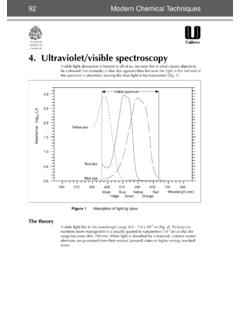
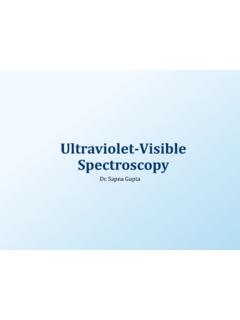
7 The reference cell orcuvette contains the solvent in which the sample isdissolved and this is commonly referred to as the each wavelength the intensity of light passing through both a reference cell (Io) and the sample cell (I) is measured. If Iis less than Io, then the sample hasabsorbed some of the absorbance (A) of the sample is related to Iand Ioaccording to the following equation:The detector converts the incoming light into a current, the higher the current the greater the intensity. The chartrecorder usually plots the absorbance against wavelength(nm) in the UV and Visible section of the electromagneticspectrum. (Note: absorbance does not have any units).UV- Visible SpectrometerCopyright 2009 Royal Society of Chemistry 3 Ultraviolet - Visible Spectroscopy (UV)MONOCHROMATORBEAMSPLITTERSAMPLECELLR EFERENCECELLRATIODETECTORSPRISMSOURCERed OrangeYellowGreenBlueVioletUV RegionVisible Region Colour WheelBlueVioletRedOrangeGreenYe l l o w800 nm - Visible Region400 nm190 nm620 nm590 nm570 nm495 nm450 nmIf a substance absorbs appears as this colour400 nmRedRedOrangeOrangeYellowYellowGreenGre enBlueBlueVioletVioletRed 620-750 nmOrange 590-620 nmYellow 570-590 nmGreen 496-570 nmBlue 450-495 nmViolet 380-450 nmRSC-BTL-946 SIAS S 8/7/09 11:46 Page 13UV- Visible SpectrumThe diagram below shows a simple UV- Visible absorptionspectrum for buta-1,3-diene.
8 Absorbance (on the verticalaxis) is just a measure of the amount of light can readily see what wavelengths of light areabsorbed (peaks), and what wavelengths of light aretransmitted (troughs). The higher the value, the more of a particular wavelength is being absorption peak at a value of 217 nm, is in the ultra-violet region, and so there would be no Visible sign of anylight being absorbed making buta-1,3-diene wavelength that corresponds to the highest absorptionis usually referred to as lambda-max (lmax).The spectrum for the blue copper complex shows that thecomplementary yellow light is Beer-Lambert LawAccording to the Beer-Lambert Law the absorbanceisproportionalto the concentrationof the substance insolution and as a result UV- Visible Spectroscopy can alsobe used to measure the concentration of a Beer-Lambert Law can be expressed in the form ofthe following equation.
9 A = eeclWhere A= absorbance l= optical path length, dimension of the cellor cuvette (cm)c= concentration of solution (mol dm-3)ee= molar extinction, which is constant for aparticular substance at a particularwavelength (dm3mol-1cm-1)If the absorbance of a series of sample solutions ofknown concentrations are measured and plotted against their corresponding concentrations, the plot ofabsorbance versus concentrationshould be linear if the Beer-Lambert Law is obeyed. This graph is knownas a calibration calibration graph can be used to determine theconcentration of unknown sample solution by measuringits absorbance, as illustrated the absorbance for dilute solutions is directlyproportional to concentration another very usefulapplication for UV- Visible Spectroscopy is studyingreaction kinetics.
10 The rate of change in concentration ofreactants or products can be determined by measuringthe increase or decrease of absorbance of colouredsolutions with time. Plotting absorbance against time onecan determine the orders with respect to the reactants andhence the rate equation from which a mechanism for thereaction can be proposed. Copyright 2009 Royal Society of Chemistry 4 Ultraviolet - Visible Spectroscopy (UV)Maximum absorption at this (nm)max=217nmabsorbance35040045050055060 0650700wavelength (nm)RSC-BTL-946 SIAS S 8/7/09 11:46 Page 14 Modern Applications of UV SpectroscopyUV- Visible Spectroscopy is a technique that readily allowsone to determine the concentrations of substances andtherefore enables scientists to study the rates of reactions,and determine rate equations for reactions, from which amechanism can be proposed.