Transcription of Ultraviolet-Visible Spectroscopy - Manu's Adventures
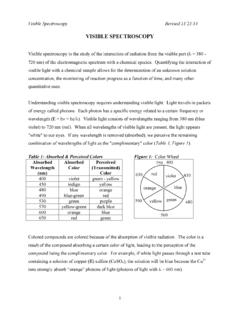
1 Ultraviolet-Visible Spectroscopy Dr. Sapna Gupta Ultraviolet-Visible Spectroscopy In both UV (200-400 nm) and visible regions (400-800 nm), photons excite electrons from a bonding orbitals to antibonding orbital electron transitions are occurring. Conjugated dienes have MO's that are closer in energy. A compound that has a longer chain of conjugated double bonds absorbs light at a longer wavelength. UV-Vis Spectroscopy 2. Why Lycopene is Red Lycopene absorbs visible light at max = 470 nm, in the blue-green region of the visible spectrum. Because it does not absorb light in the red region, lycopene appears bright red. UV-Vis Spectroscopy 3. * for ethylene and butadiene UV-Vis Spectroscopy 4. Conjugation and MOs UV-Vis Spectroscopy 5.
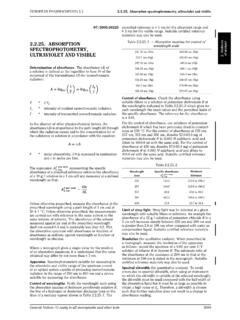
2 Obtaining a UV-Vis Spectrum The spectrometer measures the intensity of a reference beam through solvent only (I) and the intensity of a beam through a solution of the sample (I0). Absorbance is the log of the ratio Sample Preparation: dissolve the sample in a Vis range invisible solvent for most organic samples CH2Cl2 and MeOH. These solvents may not be good for UV region. Sample can be recovered after analysis. UV-Vis Spectroscopy 6. The UV-Vis Spectrum Usually shows broad peaks. Read max from the graph. Absorbance, A, follows Beer's Law: A = cl where is the molar absorptivity (extinction coefficient), c is the sample concentration in moles per liter, and l is the length of the light path in centimeters.
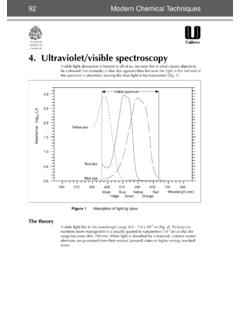
3 UV Spectrum of Isoprene UV-Vis Spectroscopy 7. Sample UV-Vis Absorptions UV-Vis Spectroscopy 8. visible Region Absorption of Dyes Dyes absorb in the visible region because of conjugation. Methyl orange ( max =440 nm) Indigo ( max =600 nm). Congo Red ( max =500 nm). Conjugated System 9. Chlorophyll a and b UV-Vis UV-Vis Spectroscopy 10. Key Concepts Recognize conjugation Predict which molecule will absorb in the red or violet region of UV-Vis. UV-Vis Spectroscopy 11.