Transcription of Operational Amplifier AC Specifications and Applications
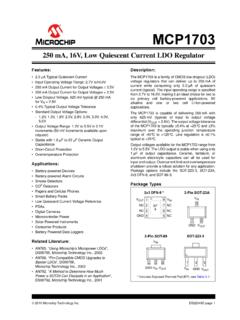
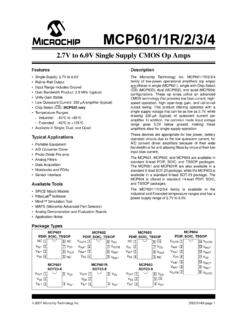
1 AN723. Operational Amplifier AC Specifications and Applications Author: Bonnie C. Baker Microchip Technology Inc. VDD. INTRODUCTION IIN- This application note defines the ac Specifications of CCM. voltage feedback Operational amplifiers (Op Amps). Directly following these definitions, related Amplifier cir- RO VOUT. CDIFF. cuits are given where the ramifications of the particular VOSAOL(s). Specifications causes less than optimum circuit perfor- mance. This is then followed with appropriate circuit IIN+. companion application note for DC spec- eN VOS. ifications along with various application circuits is titled CCM. Operational Amplifier Topologies and DC Specifica- VSS. tions , AN-722 and available on Microchip's web site. The performance Specifications discussed in this appli- cation note are separated into the two categories listed below. FIGURE 1: voltage Feedback Operational Frequency Domain Specifications Amplifier frequency model.
2 - Gain Bandwidth Product (GBWP). In this figure, the Amplifier is shown with five terminals. - Open Loop Gain/Phase (AOL,PH) The two input terminals have an offset voltage error - Load Capacitance (CL) - Output Impedance (ZO) (VOS), a noise source (eN) and differential capacitance - Full Power Bandwidth (FPBW) (CDIFF). The finite impedance of the output terminal is modeled using RO. The Amplifier 's open loop gain over Time Domain Specifications frequency is represented by the term AOL(j ). This gain - Slew Rate (SR) term can be described in simple terms with the 2nd - Settling Time (tS) order transfer function: - Overshoot A O L ( DC ). Topics such as bode plot generation, bode plot transla- A OL ( j ) = ---------------------------------------- -- - ( as + 1 ) ( bs + 1 ). tion, stability analysis and feedback theory are dis- cussed throughout this application note. Where: Additionally, there are numerous ac performance a = the location of the dominant pole and aspects of an Operational Amplifier that can be b = the location of the second pole described from the frequency domain perspective or the time domain perspective.
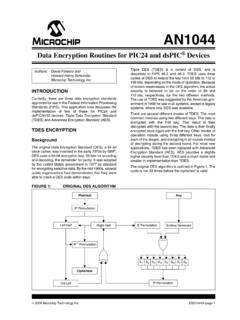
3 For instance, Amplifier FREQUENCY DOMAIN. stability can be described in the frequency domain with the closed loop phase margin and its relationship to the Specifications . Amplifier open loop gain. In the time domain, the phase Bode Plot Analysis Method margin, in degrees, can be directly mapped to the set- tling time, and overshoot. Where appropriate, discus- The bode plot is a tool that is used to approximate the sions in this application note will establish the magnitude and phase of a transfer function. An exam- correlation between these two domains. ple of the op amp gain and phase bode plots are shown in Figure 2. The ac op amp open loop model that will be referred throughout this discussion is shown in Figure 1. 2000 Microchip Technology Inc. Preliminary DS00723A-page 1. AN723. Application Challenge - An Amplifier configured as a buffer is shown in Figure 3. In this circuit, the buffer is used to electrically isolate conflicting impedances or to thermally isolate heavy loads.
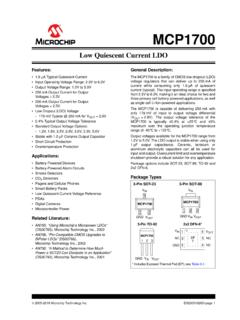
4 In this application, the Amplifier selected must be unity gain stable. A good stability test for a buffer is to apply a square wave to the input of the Amplifier . The overshoot and ringing at the output of the Amplifier will directly reflect the phase shift at the frequency where the gain is down 3dB. For example, the bode plot of an Amplifier that is not unity gain stable is shown in Figure 4. When this ampli- fier is configured as a buffer, the step response will show that the Amplifier has a tendency to oscillate (Figure 5). The only remedy to this application problem FIGURE 2: The frequency response of an is to select an Amplifier that is unity gain stable. This is analog system can be characterized with a bode shown with the response of a second Amplifier whose plot. The bode plot graphically describes gain bode plot response is shown in Figure 6 and step and phase of the system.
5 Response is shown in Figure 7. These two plots illustrate the gain (top) and phase R1 R2. response (bottom) of a typical op amp. The units of the y-axis of the gain curve are decibels (dB). Decibels can VS. be translated to volts with the formula: VDD. *. V O U T ( j ) . A OL ( j ) in dB = 20 log ------------------------- * VOUT. VIN ( j ) VIN. MPC601. +. The units of the y-axis of the phase plot is in degrees. Degrees can be converted to radians with the formula: Buffer Precision Amplifier Phase in radians = (Phase in degrees) / 2 . Phase in degrees can be translated to phase delay or *Bypass Capacitor, 1 F. group delay (seconds), with the formula: FIGURE 3: A typical application for an Phase delay = ( phase in degrees/ f)/360 Amplifier is the voltage buffer or follower. Both plots are aligned on the same frequency scale with their respective x-axis. Gain Bandwidth Product (GBWP). specification Discussion - The Gain Bandwidth Prod- uct (GBWP) of an Amplifier is the product of the ampli- fier open loop gain times the frequency at any point in the frequency range where the Amplifier response is attenuating at a rate of -20dB per decade of frequency.
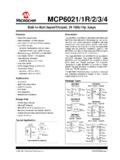
6 By definition, if an Amplifier is unity gain stable, it does not oscillate when the non-inverting input is used for the signal input and the inverting input is connected directly to the output. The unity gain bandwidth of the Amplifier is equivalent to the Amplifier 's GBWP. The fact that an Amplifier is unity gain stable implies that the phase shift from the non-inverting input to output is between zero and -180 degrees at the zero dB crossing of the open FIGURE 4: A bode plot of an Amplifier that is loop gain curve. Some amplifiers are not unity gain sta- not unity gain stable. This condition exists ble, in which case, the open loop gain zero crossing fre- because the phase at the zero dB crossing quency is less than the GBWP. frequency is nearly -180 degrees. DS00723A-page 2 Preliminary 2000 Microchip Technology Inc. AN723. Open Loop Gain/Phase (AOL, PH). specification Discussion - Ideally, the open loop gain of an Amplifier is equal to the absolute value of the ratio of the voltage at the output terminal divided by the differ- 1V/div ence of the voltages applied between the two input ter- minals.
7 V OU T . AO L (dB) = 20 log ----------------------------- . V IN + VIN - . It would be ideal if the open loop gain ratio were infinite, but in reality, the complete frequency response of the Time (10usec/div open loop gain, AOL(j ), is less than ideal at DC and attenuates at a rate of 20dB/decade beginning at the FIGURE 5: The unity gain step response of frequency where the first pole in the transfer function the Amplifier specified with the bode plot of appears. This is illustrated in the bode plot in Figure 2. Figure 4 demonstrates the instability of the Usually, the first pole of the open loop response of an Amplifier . Operational Amplifier occurs between 1Hz to 10kHz. The second pole occurs at a higher frequency, nearer to the frequency where the open loop gain curve 120 200 crosses 0dB. The gain response of an Amplifier starts CL = 50pF, 100 RL = 100k 150 to fall off at 40dB/decade at the frequency where the Gain Phase Margin (degrees).)
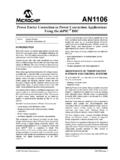
8 80 VDD = 5V 100 second pole occurs. Open Loop Gain (dB). 60 50. The phase response of an Amplifier in this open loop 40 0. configuration is also fairly predictable. The phase shift 20 -50. or change from the non-inverting input to the output of 0 -100. Phase the Amplifier is zero degrees at DC. Conversely, the -20 -150. phase from the inverting input terminal to the output is -40 -200. equal to -180 degrees at DC. -60 -250. 10. 10 1K. 1000 100K 10000000. 100000 10M At one decade (1/10 f1) before the first pole, f1, the Frequency (Hz) phase relationship of non-inverting input to output has already started to fall (~ degrees). At the frequency FIGURE 6: Bode plot of the MCP601 unity where the first pole appears in the open loop gain curve (f1), the phase has dropped to -45 degrees. The gain Amplifier . resultant phase continues to drop for another decade (10f1) where it is degrees above its final value of -90 degrees.
9 This phase response discussion can be repeated for the second pole, f2. VDD = 5V What is important to understand is the ramifications of RL = 100k the changes in this phase relationship of the input to CL=50 pF output of the Amplifier . One frequency decade past the 50 mV/div G = +1V/V second pole, the phase shift of the non-inverting input is -180 degrees. At this same frequency, the phase shift of the inverting input to output is zero or -360 degrees. With this type of shift, VIN+ is actually inverting the sig- nal to the output. In other words, the role of the two inputs have reversed. 1 S / div Stability in Closed Loop Amplifier Systems FIGURE 7: Step response of the unity gain Typically, op amps are used with a feedback network in order to reduce the variability of the open loop gain stable MCP601 Amplifier . response from part to part. A block diagram of this type of network is shown in Figure 8.
10 2000 Microchip Technology Inc. Preliminary DS00723A-page 3. AN723. This is a very important result. If the open loop gain (AOL(j )) of Amplifier is allowed to approach infinity, the C response of the feedback factor can easily be evalu- VIN + ated as: D VOUT. AOL(j ) 1. A A C L ( j ) = -------------- ( j ). - This formula allows an easy determination of the fre- B quency stability of an Amplifier 's closed loop system. (j ). Calculation of 1/ - The easiest technique that can be used to calculate 1/ is to place a source directly on the non-inverting input of the Amplifier . One could argue FIGURE 8: A block diagram of an Amplifier that this calculation will not give the appropriate circuit circuit which includes the Amplifier gain cell, AOL, closed loop gain equation for the actual signal and this and the feedback network, . is true. But this calculation can be used to ascertain the level of circuit stability.