Transcription of Printed on July 24, 2018 RBC Global Dividend Growth Fund
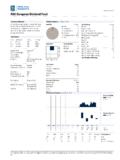
1 Printed on July 24, 2018 2018. Morningstar Research Inc. All Rights Reserved. The information contained herein: (1) is proprietary to Morningstar and/or its content providers; (2) may not be copied or distributed; and (3) is not warranted to be accurate, complete ortimely. Neither Morningstar nor its content providers are responsible for any damages or losses arising from any use of this information. Past performance is no guarantee of future results. These pages are not complete without the Global Dividend Growth FundInvestment ObjectiveTo provide long-term capital Growth by investing in equitysecurities of a diversified mix of companies operating invarious countries around the world across a range DetailsSeriesLoad StructureCurrencyFund CodeANo LoadCADRBF565 ANo LoadUSDRBF414 AdvDeferred SalesCADRBF803 AdvFront EndCADRBF703 AdvLow LoadCADRBF176 AdvLow LoadUSDRBF4414T5No LoadCADRBF540T8No LoadCADRBF600 Inception DateDecember 2000 Total Fund Assets $Mil2, A NAV $ A MER % World Total ReturnNet Index (C$)Income DistributionAnnuallyCapital Gains DistributionAnnuallySales StatusOpenMin.
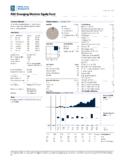
2 Investment $500 Subsequent Investment $25 Fund CategoryGlobal EquityManagement CompanyRBC Global AssetManagement Analysis is in CAD and for CAD series Afund (RBF565).This is a continuing fund resulting from a mergereffective June 27, Analysisas of June 30, 2018 Asset Mix% StyleValueBlendGrowthLargeMidSmallEquity StatisticsP/B Mkt Cap. $ 5 Sectors% Allocations% AssetsUnited 25 Holdings% AssetsMicrosoft Group Companies Estee Lauder Companies Inc Class Semiconductor Manufacturing Group Resources Hotels Group Chase & Holding AG Dividend Right Republic Post InBev NV Dutch Shell PLC Bank Ltd Group Petroleum International Group % of Top 25 Number of Stock Holdings40 Total Number of Bond Holdings0 Total Number of Other Holdings1 Total Number of Holdings41 Performance Analysis as of June 30, 2018471013161922 Growth of $10,000 Series A$17, Returns %Series AFundQuartile1 Mth3 Mth6 Mth1 Yr3 Yr5 Yr10 YrSince Return % Quartile18331755173616091068751418 No.
3 Of Funds in CategoryPrinted on July 24, 2018 2018. Morningstar Research Inc. All Rights Reserved. The information contained herein: (1) is proprietary to Morningstar and/or its content providers; (2) may not be copied or distributed; and (3) is not warranted to be accurate, complete ortimely. Neither Morningstar nor its content providers are responsible for any damages or losses arising from any use of this information. Past performance is no guarantee of future results. These pages are not complete without the Global Dividend Growth FundManagement OverviewManager BiosHabib SubjallyRBC Global Asset Management (UK) LimitedHabib has served as Head of Global Equities and leaderof this team since 2006. Prior to that, he held positions atCredit Suisse (Head of Small & Mid Cap Research),Invesco (Head of Global Equities), Merrill LynchInvestment Managers (Head of North American andGlobal Equities Research, and Manager, Mercury GlobalTitans Fund) and Ernst & Young.
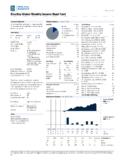
4 Habib holds a BSc (Hons)from the London School of Economics and the CharteredAccountant and ASIP Analysis Cont'd as of June 30, 2018 Distributions ($)/UnitYTD*2017201620152014201320122011 201020092008 Total Distributions Capital Gains Return Of Capital EndedEndedEndedEnded12-20137-20157-20156 -20182-20095-20102-20099-2011 Best/Worst Periods %1 Yr3 Yr5 Yr10 of Periods19917515191 Pct. * Distributions are characterized into income type at Commentary as at June 30, 2018 Global equity markets continued to be volatile inQ2. Markets have been buffeted by a string ofmacro factors including an escalating trade warbetween the and China now extended to theEU and Canada, a substantial slump in Chineseequity prices and a reversal of the positivitytoward Europe early in 2018.
5 Against this, thereremained a strong bid for some of the largest names and the buoyant oil price wassupportive of energy holding in discount retailer, TJXC ompanies Inc., was the biggest contributor torelative returns over the quarter as the stockadvanced on strong year-on-year same-store salesgrowth. onshore oil exploration andproduction companies, EOG Resources Inc. andOccidental Petroleum Corp., also contributed toreturns. EOG s stock rose on continued operationalperformance and both companies benefited fromthe steady appreciation of oil prices throughoutthe holding in German logistics company,Deutsche Post DHL Group, was the biggestdetractor from relative returns during the stock fell after the company reported weaker-than-expected results as its postal and supplychain weakness offset strong numbers from itsexpress delivery division.
6 Management alsoannounced reduced earnings guidance onrestructuring costs. Taiwanese semiconductormanufacturer, Taiwan SemiconductorManufacturing Company Ltd., also detracted afterthe stock fell following disappointing Q1 resultsand reduced guidance on projected smartphonedemand. Another top detractor was Est e LauderCompanies Ltd., which fell toward the end of thequarter after a very strong run and concerns of amodest impact from potential Chinese always, the team remains committed to thediscovery of companies that we deem to be futuresuccess stories. We are constantly searching forcompelling long-term opportunities at the rightvaluations while avoiding businesses that areovervalued or optically cheap, but on July 24, 2018 2018. Morningstar Research Inc. All Rights Reserved.
7 The information contained herein: (1) is proprietary to Morningstar and/or its content providers; (2) may not be copied or distributed; and (3) is not warranted to be accurate, complete ortimely. Neither Morningstar nor its content providers are responsible for any damages or losses arising from any use of this information. Past performance is no guarantee of future results. These pages are not complete without the Global Dividend Growth FundDisclosureRBC Funds, BlueBay Funds, PH&N Funds andRBC Corporate Class Funds are offered byRBC Global Asset Management Inc. anddistributed through authorized , trailing commissions,management fees and expenses all may beassociated with mutual fund read the prospectus or Fund Factsdocument before investing. Except asotherwise noted, the indicated rates of returnare the historical annual compounded totalreturns including changes in unit value andreinvestment of all distributions and do nottake into account sales, redemption,distribution or optional charges or incometaxes payable by any unitholder that wouldhave reduced returns.
8 Mutual funds are notguaranteed or covered by the CanadianDeposit Insurance Corporation or by any othergovernment deposit insurer. For moneymarket funds, there can be no assurancesthat the fund will be able to maintain its netasset value per unit at a constant amount orthat the full amount of your investment in thefund will be returned to you. The value ofmutual funds change frequently and pastperformance may not be document has been compiled by RBCG lobal Asset Management Inc. (RBC GAM)from sources believed to be reliable, but norepresentations or warranty, express orimplied, are made by RBC GAM, its affiliatesor any other person as to its accuracy,completeness or correctness. All opinionsand estimates constitute RBC GAM'sjudgment as of the date of this document, aresubject to change without notice and areprovided in good faith but without legalresponsibility.
9 The Top Ten/25 Holdings maychange due to ongoing portfolio transactionswithin the fund. The Prospectus and otherinformation about the underlying investmentfunds are available at (%) for RBC Funds, PH&N Funds andBlueBay Funds is based on actual expensesfor the full year period, January 1 toDecember 31, 2017, expressed on anannualized (%) for RBC Corporate Class Funds isbased on actual expenses for the full yearperiod, April 1, 2017 to March 31, H and Series I are not available forpurchase by new investors. Existinginvestors who hold Series H or Series I unitscan continue to make additional investmentsinto the same series of the funds they are only used to illustrate the effectsof the compound Growth rate and do notreflect future values of any fund or returns oninvestment of any fund profile is provided for informationalpurposes only.
10 Particular investments and/ortrading strategies should be evaluatedrelative to each individual s investmentobjectives. The information contained in thefund profile is not, and should not beconstrued as, investment or tax advice. Youshould not act or rely on the informationcontained in the fund profile without seekingthe advice of an appropriate rankings are determined byMorningstar Research Inc., an independentresearch firm, based on categoriesmaintained by the Canadian InvestmentFunds Standards Committee (CIFSC). Quartilerankings are comparisons of the performanceof a fund to other funds in a particularcategory and are subject to change quartiles divide the data into four equalsegments expressed in terms of rank (1, 2, 3or 4). This is the Morningstar quartile rankingof Series A and F units of the Fund as of June30, 2018.