Transcription of Protein secondary structure elucidation using FTIR ...
1 AbstractFourier-transform infrared (FTIR) spectroscopy is one of the most versatile analytical tools used across various disciplines. In this study, the Thermo Scientific Nicolet iS10 and Nicolet iS50 FTIR spectrometers, equipped with Attenuated Total Reflection (ATR)-FTIR and Transmission-FTIR, were used for the determination of Protein secondary structures. structure calculations based on a Protein database as well as spectral deconvolution are discussed. The analyses were quick and secondary structure describes the repetitive conformations of proteins and peptides. There are two major forms of secondary structure , the -helix and -sheet, so named by the patterns of hydrogen bonds between amine hydrogen and carbonyl oxygen atoms that create the peptide backbone of a Understanding Protein secondary structure is important to gain insight into Protein conformation and stability.
2 For example, temperature dependent analysis of the secondary structure is critical in determining storage conditions for maintaining active therapeutic Protein secondary structure is also crucial in understanding the structure -function relationship and enzyme kinetics of various has long been established as a powerful analytical technique to investigate Protein secondary structure and local conformational , 4 A typical Protein infrared (IR) spectrum often contains nine amide bands, with vibrational contributions from both Protein backbone and amino acid side chains. Among which, of particular pertinence to Protein secondary structure are Amide I and Amide II bands. The absorptions associated with C=O stretching are denoted as Amide I, whereas those associated with N H bending are Amide II.
3 Since both C=O and N H bonds are involved in the hydrogen bonding between different moieties of secondary structure , the positions of both Amide I and Amide II bands are sensitive to the secondary structure composition of a Protein ,3, 4 although the Amide II band is widely viewed as a less useful predictor for quantifying the secondary structure of Sukumaran Thermo Fisher Scientific, USAK eywordsFTIR, ATR, Protein structure elucidation , Biocell calcium fluoride cell, ConcentrateIR2 ATR, transmissionProtein secondary structure elucidation using FTIR spectroscopyAPPLICATION NOTE AN52985 The shifts in the Amide I band are often small compared to the intrinsic width of the band, resulting in one broad peak instead of a series of resolved peaks for each type of the secondary structure .
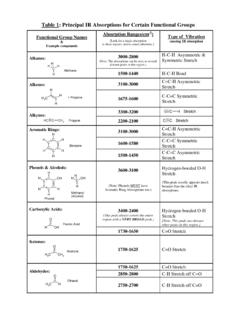
4 Mathematical procedures such as Fourier self-deconvolution and second derivatives can be used to resolve the overlapping bands for the quantitative analysis of Protein secondary Table 1 shows the secondary structure band assignments for proteins in water. Note that all assignments are depicted as a range, as the exact position of each peak varies from Protein to Protein due to the differences in hydrogen bonding interactions and the environment of the a range of sampling techniques, including transmission, ATR, and infrared reflection absorption spectroscopy (IRRAS), FTIR is particularly advantageous in terms of its versatility and general applicability compared to other analytical techniques for Protein secondary structure analysis.
5 Protein sample forms suitable for FTIR analysis include lyophilized powders, water solution, and colloids, to name a few. We report herein two examples of Protein secondary structure determination using transmission-FTIR and ATR, respectively. Both methods are fast, consume a minute amount of sample, and require minimal sample proteins were procured from Sigma-Aldrich (MO, USA) and used as received. For the transmission studies, a BioCell Calcium Fluoride Cell (Biotools, Jupiter, FL) was used, and all measurements were carried out at ambient temperature. A 10 L Protein solution was placed at the center of the window, and the Protein solution was sandwiched between the two CaF2 windows, and placed in the holder.
6 The concentration of Protein tested was between 6 and 12 mg/mL. A 6 m path length was created by sandwiching secondary StructureBand Assignment in Water -Helix1648-1657 cm-1 -Sheet (high frequency component)1623-1641 cm-11674-1695 cm-1 Random1642-1657 cm-1 Coils1662-1686 cm-1the two CaF2 windows. CaF2 windows are suited for water-based sample analysis. As water has a significant absorption peak at 1645 cm-1 region, a small path length of 6 m can effectively avoid saturated water purged Nicolet iS10 FTIR spectrometer, equipped with a DTGS detector, was used for transmission analysis. The scan parameters used were 256 scans, resolution of 4 cm-1. The Thermo Scientific Smart OMNI-Sampler Transmission Accessory allows for a quick purge of the chamber, eliminating the need for water vapor subtraction in most analyses.
7 secondary structure analysis of the buffer-subtracted spectra was carried out using the built-in feature of the PROTA-3S FT-IR Protein structure Analysis Software. secondary structure calculation in PROTA-3S software is based on a database of 47 secondary structures (for more information visit ).For ATR analysis, a ConcentratIR2 Multiple Reflection ATR Accessory (Harrick Scientific Products, Inc. Pleasantville, NY) with diamond crystal was used in a Nicolet iS50 FTIR spectrometer equipped with an mercuric cadmium telluride (MCT) detector. The diamond ATR has ten internal reflections with a nominal angle of incidence of 45 . A 10 L Protein solution in phosphate buffer was dried on the surface of the ATR crystal under a stream of nitrogen.
8 Scan parameters used were 256 scans and a resolution of 4 cm-1. secondary structure determination was carried out using the peak resolve feature of the OMNIC and discussionTransmission-FTIR with Biocell Figure 1 shows the overlay of three FTIR spectra: phosphate buffer, cytochrome C at 6 mg/mL and 12 mg/mL in phosphate buffer, respectively. At first glance, the spectra are predominantly water bands. The three spectra show little difference, even at a high Protein concentration of 12 mg/mL. Table 1: secondary structure band assignments for Protein in 1: Transmission-FTIR spectra for cytochrome C in phosphate buffer (cytc_12) at 12 mg/mL and 6 mg/mL (cytc_6), and phosphate buffer blank. -Helix (%) -Sheet (%)Random (%)ProteinFTIRX-rayFTIRX-rayFTIRX-rayCyt ochrome C4541505059 Concanavalin A4042485452 Next, the buffer spectrum was subtracted from the raw Protein spectra using the PROTA-3S software, and the results are shown Figures 2A (cytochrome C) and 2B (concanavalin).
9 The Amide I and II peaks are clearly discernible in both spectra. The Amide I peak position for cytochrome C spectra is 1654 cm-1, suggesting an -helix dominant secondary structure . For Concanavalin A, the Amide I peak centers at 1633 cm-1, and there is also a noticeable shoulder peak at 1690 cm-1 (red circle), indicative of the -sheet component and its associated high-frequency 2 summarizes the secondary structure prediction using the PROTA-3S software. The cytochrome C has 45% -helix and 5% -sheet, whereas Concanavalin A has 42% -sheet and 4% -helix. Differences in secondary structure composition between X-ray and FTIR data are likely due to the physicochemical state of the Protein samples such as crystalline versus solution, temperature, pH, buffer conditions, etc.
10 Furthermore, different prediction algorithms could have slightly varying Notwithstanding the differences in analytical technique, sample state, and prediction algorithms, the secondary structure elucidation by FTIR using PROTA-3S software is largely in line with that from X-ray. Transmission-FTIR measurements combined with PROTA-3S software offer a facile and fast means to analyze the secondary structure of proteins in solution2, 3 with minimal sample with ConcentrateIR AccessoryWhen the quantity and concentration of Protein are limited, FTIR measurements with the ConcentratIR2 ATR accessory offer a better alternative than transmission-FTIR spectroscopy. The unique design of this ATR accessory allows for the direct measurement of Protein powders, gels, solutions as well as proteins dried on the ATR surface.