Transcription of Quarterly Market Update
1 Commentary First Quarter 2022. Quarterly Market Update PRIMARY CONTRIBUTORS. Lisa Emsbo-Mattingly, CBE Jake Weinstein, CFA Andrew Garvey Director of Asset Allocation Research Research Analyst, Asset Allocation Research Research Analyst, Asset Allocation Research Dirk Hofschire, CFA Jenna Christensen SVP, Asset Allocation Research Research Associate, Asset Allocation Research Table of Contents Market Summary Economy/Macro Backdrop Asset Markets Long-Term Themes Market Summary Positive Mid- cycle Backdrop, but Volatility on the Rise Asset prices experienced some intra-quarter ups and downs as markets grappled with an uneven global SUMMARY.
2 Expansion, high inflation, and the beginning of a shift toward less accommodative monetary policy. We expect the constructive mid- cycle backdrop to prevail during 2022, but less favorable monetary policy and a host of other uncertainties raise the odds of higher Market volatility. MACRO ASSET MARKETS. Q4 2021 Global economic expansion continued, but Asset prices generally rose but with narrower momentum wavered. leadership. OUTLOOK The peaking global industrial cycle and Slower liquidity growth and multiple sources of Omicron variant offer near-term headwinds for uncertainty raise the odds of higher Market global growth momentum.
3 Volatility. Mid- cycle conditions in the should prevail. Policy decisions are likely to have an increasingly China's industrial cycle appears to be large influence on asset returns. bottoming, though reacceleration upside Buoyant asset valuations reflect positive appears limited. expectations built into asset prices. Inflation rates should moderate from high Cyclical outlook remains constructive, but levels, but inflation pressures may prove more portfolio diversification is as important as ever. persistent than expected. Monetary and fiscal policy are shifting from big tailwinds to potential headwinds. 4 Diversification does not ensure a profit or guarantee against a loss.
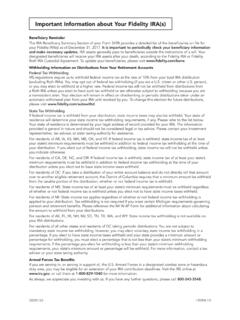
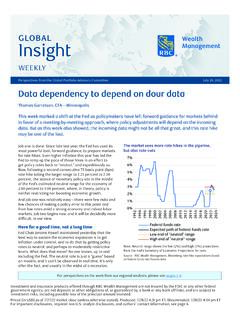
4 Strong Q4 Rally Caps off Banner Year for stocks Large cap stocks staged a year-end upswing, underpinning another positive year for global stock prices, but SUMMARY. performance was mixed across categories. Investment-grade bonds finished the year in the red amid the modest rise in interest rates, while equity categories lagged as emerging- Market stocks dropped due in part to China's downturn. Real estate stocks , commodities, and high-yield bonds all posted solid 2021 returns. Q4 2021 (%) 1 Year (%) Q4 2021 (%) 1 Year (%). Real Estate stocks High Yield Bonds Large Cap stocks Corporate Bonds Commodities Emerging- Market Bonds Mid Cap stocks Investment-Grade Bonds Small Cap stocks Long Government & Credit Bonds Developed-Country stocks Emerging- Market stocks Small Cap stocks Gold 20-Year Stock Returns Minus IG Bond Returns Since 1946.
5 Annualized Return Difference 15%. 13%. 11%. 9%. 7% Average since 1946: 5%. 5% 3%. 1%. -1%. -3%. 1946. 1948. 1950. 1952. 1954. 1956. 1958. 1960. 1962. 1964. 1966. 1968. 1971. 1973. 1975. 1977. 1979. 1981. 1983. 1985. 1987. 1989. 1991. 1993. 1996. 1998. 2000. 2002. 2004. 2006. 2008. 2010. 2012. 2014. 2016. 2018. 2021. Past performance is no guarantee of future results. It is not possible to invest directly in an index. All indexes are unmanaged. See Appendix for important index information. IG: Investment grade. Assets represented by: Commodities Bloomberg Commodity Index; Emerging- Market Bonds JP Morgan EMBI Global Index; Emerging- Market stocks MSCI EM Index.
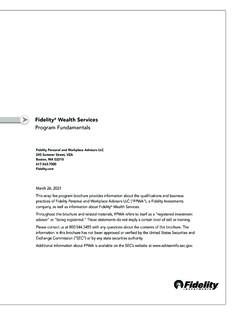
6 Gold Gold Bullion, LBMA PM Fix; High-Yield Bonds ICE BofA High Yield Bond Index; Investment-Grade Bonds Bloomberg Aggregate Bond Index; Developed-Country stocks MSCI EAFE Index; Small Cap stocks MSCI EAFE Small Cap Index; Real Estate stocks FTSE NAREIT Equity Index;. Corporate Bonds Bloomberg Credit Index; Large Cap stocks S Mid Cap stocks Russell Midcap Index;. Small Cap stocks Russell 2000 Index; Long Government & Credit Bonds Bloomberg Long Government & Credit Index. 5 Source: Bloomberg Finance , Haver Analytics, Fidelity Investments Asset Allocation Research Team (AART), as of 12/31/21. Robust Earnings Recovery Propelled Stock Price Gains While the 2020 global stock Market rally was driven by higher valuation multiples during a profit recession, the SUMMARY.
7 2021 stock price gains were undergirded by a strong rebound in earnings growth. The pattern was typical of early- to mid- cycle transition, where investor expectations anticipate the profit recovery. stocks also posted strong profit growth in 2021, but they underperformed equities due to greater valuation compression. Decomposition of S&P 500 Returns Decomposition of vs. Relative Returns Earnings Dividend Yield Valuation Multiples Total Earnings Dividend Yield Valuation Multiples Total Year-Over-Year Growth Year-Over-Year Growth Difference 70% 4%. 60% 2%. 50% 0%. 40% -2%. 30% -4%. 20% -6%. 10% -8%. 0% -10%. -10% -12%.
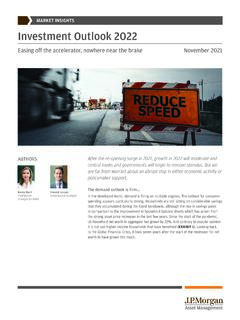
8 -20% -14%. -30% -16%. -40% -18%. 2019 2020 2021 Average 2019 2020 2021. 1990 2018. LEFT: Source: Haver Analytics, Standard & Poor, Fidelity Investments, as of 12/31/21. RIGHT: represented by MSCI All Country World Index (ACWI) ex USA Index in local currency minus the decomposition of the S&P 500. Source: Haver Analytics, Standard & Poor, MSCI, 6 Bloomberg Finance , Fidelity Investments (AART), as of 12/31/21. Real Yields Became Even More Negative during Q4. Nominal 10-year Treasury bond yields barely budged during Q4, but higher inflation expectations pushed real SUMMARY. yields the inflation-adjusted cost of borrowing even more deeply into negative territory.
9 For the full year, the rise in inflation expectations drove nearly the entire increase in nominal yields from their 2020 historical lows. As of the end of 2021, high inflation expectations and low real yields were at or near multi-year extremes. 10-Year Government Bond Yields Inflation Expectations Real Yields Nominal Yield Change in Yields (Basis Points). Q4 2021 2021. Yield Inflation Expectations +19 +57. Real Yields -19 +2. Nominal Yield 0 +59. Dec-11. Dec-12. Dec-13. Dec-14. Dec-15. Dec-16. Dec-17. Dec-18. Dec-19. Dec-20. Dec-21. Jun-12. Jun-13. Jun-14. Jun-15. Jun-16. Jun-17. Jun-18. Jun-19. Jun-20. Jun-21. 7 Source: Bloomberg Finance , Fidelity Investments (AART), as of 12/31/21.
10 Economy/Macro Backdrop Multi-Time-Horizon Asset Allocation Framework Fidelity's Asset Allocation Research Team (AART) believes that asset-price fluctuations are driven by a ECONOMY. confluence of various factors that evolve over different time horizons. As a result, we employ a framework that analyzes trends among three temporal segments: tactical (short term), business cycle (medium term), and secular (long term). DYNAMIC ASSET ALLOCATION TIMELINE. HORIZONS. Secular (10 30 years). Business cycle (1 10 years). Tactical (1 12 months). Portfolio Construction Asset Class | Country/Region | Sectors | Correlations 9 For illustrative purposes only.