Transcription of RBC Balanced Fund
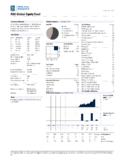
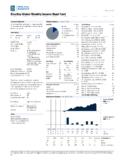
1 Printed on July 24, 2018. RBC Balanced fund Investment Objective Portfolio Analysis as of June 30, 2018. To provide a combination of capital growth and modest Asset Mix % Assets Top 25 Holdings % Assets income by investing primarily in a balance of Canadian Cash RBC Emerging Markets Equity fund equities, bonds and short-term debt securities. Fixed Income Royal Bank of Canada Canadian Equity The Toronto-Dominion Bank fund Details US Equity Bank of Nova Scotia Series Load Structure Currency fund Code International Equity Suncor Energy Inc A No Load CAD RBF272 Other Canada (Government of) 01-12-2048 Adv Deferred Sales CAD RBF838 The S&P/Tsx 60 Index Fut Adv Front End CAD RBF738 Canada (Government of) 01-09-2021 Adv Low Load CAD RBF123 Equity Style Statistics RBC Canadian Small & Mid-Cap Res fund T5 No Load CAD RBF536 P/B Ratio Canada (Government of) 01-03-2021 Large Mid T8 No Load CAD RBF596 P/E Ratio Enbridge Inc Avg.
2 Mkt Cap. $B Canadian National Railway Co Inception Date December 1987 Ontario (Province Of) 02-06-2041 Small Total fund Assets $Mil 5, Ontario (Province Of) 02-06-2039 Series A NAV $ Bank of Montreal Series A MER % Value Blend Growth Ontario (Province Of) 02-06-2022 Benchmark 45% FTSE TMX Canada Canadian Natural Resources Ltd Universe Bond Index 35% S&P/TSX Capped Top 5 Sectors % Equity Hydro Quebec 15-02-2035 Composite Total Return Financials Brookfield Asset Management Inc Class A Index Energy Ontario (Province Of) 02-06-2037 10% S&P 500 Total Return Information Technology Index (CAD) Canada (Government of) 01-03-2022 7% MSCI EAFE Total Industrials Ontario (Province Of) 02-06-2027 Return Net Index (CAD) Materials Ontario (Province Of)
3 02-06-2023 3% MSCI Emerging Quebec (Province Of) 3% 01-09-2023 Markets Total Return Net Fixed Income % Characteristics % TransCanada Corp Index (CAD) Breakdown Avg. Term to Total % of Top 25 Holdings Govt. Bonds maturity (Yrs). Income Distribution Quarterly Total Number of Portfolio Holdings 599. Corp. Bonds Modified Duration Capital Gains Distribution Annually (Yrs) Total Number of Stock Holdings 783. Other Bonds Yield to Maturity Total Number of Bond Holdings 329. MBS Sales Status Open Total Number of Other Holdings 15. Cash & Other Min. Investment $ 500 Total Number of Underlying Holdings 1,127. ABS Subsequent Investment $ 25. Performance Analysis as of June 30, 2018. 18 Growth of $10,000. fund Category Canadian Neutral Balanced 16 Series A.
4 14 $13,871. Management Company RBC Global Asset 12. Management Inc. 10. Web Site 8. 6. 10 Calendar Returns %. Series A. 0. -10. -20. -30. 2008 2009 2010 2011 2012 2013 2014 2015 2016 2017 YTD. fund 4th 4th 3rd 4th 3rd 3rd 2nd 2nd 3rd 2nd 2nd Quartile 1 Mth 3 Mth 6 Mth 1 Yr 3 Yr 5 Yr 10 Yr Since Incep. Trailing Return %. fund 2nd 2nd 2nd 2nd 3rd 2nd 4th Quartile 680 678 677 662 527 413 152 No. of Funds in Category 2018. Morningstar Research Inc. All Rights Reserved. The information contained herein: (1) is proprietary to Morningstar and/or its content providers; (2) may not be copied or distributed; and (3) is not warranted to be accurate, complete or timely. Neither Morningstar nor its content providers are responsible for any damages or losses arising from any use of this information.
5 Past performance is no guarantee of future results. These pages are not complete without the disclosure page. Printed on July 24, 2018. RBC Balanced fund Management Overview Manager Bios Performance Analysis Cont'd as of June 30, 2018. Stuart Kedwell Distributions ($)/Unit YTD* 2017 2016 2015 2014 2013 2012 2011 2010 2009 2008. RBC Global Asset Management Inc. Total Distributions . Stuart Kedwell is Senior Vice President and Co-Head, Interest . North American Equities. He has been in the investment Dividends . industry since 1997. Capital Gains . Return Of Capital . Dagmara Fijalkowski RBC Global Asset Management Inc. Best/Worst Periods % Ended 1 Yr Ended 3 Yr Ended 5 Yr Ended 10 Yr As Head of Global Fixed Income and Currencies, Best 7-1997 3-2006 8-2000 9-2005 Dagmara leads investment teams in Toronto, London and Worst 2-2009 2-2009 5-2012 8-2010 Minneapolis in charge of almost $100 billion in fixed Average income assets.
6 She heads management of several bond No. of Periods 289 265 241 181. funds and manages foreign-exchange hedging and active Pct. Positive currency overlay programs across a number of funds. * Distributions are characterized into income type at year-end. Dagmara, who began her investment career in 1994, holds an MBA from the Richard Ivey School of Business, Quarterly Commentary as at June 30, 2018. a Master's degree in economics from the University of Lodz in Poland and is a CFA charterholder. The second quarter of 2018 was marked by S. and China to engulf Europe and Canada. escalating trade tensions between the and Chinese equity prices slumped while Canadian much of the world, as President Trump made good stocks rebounded, supported by rising oil prices.
7 On his promise to institute billions of dollars in The fund 's performance was held back by an tariffs. Against this backdrop, economic overweight position in emerging-market equities, growth accelerated, while the expansion appeared offset by the positive impact of security selection to slow in Europe and emerging markets. in Canadian equities. The fund 's overweight position in equities and Economic growth slowed in the first half of 2018, underweight position in fixed income had a neutral but remains at its most solid since the financial impact on performance. Global government bonds crisis amid fiscal stimulus and business and were mixed, with Treasuries finishing the consumer optimism. The portfolio manager period essentially flat while German and Japanese bonds rose.
8 Canadian bonds posted modest gains expects continued expansion, encouraging central during the period, as the trade conflict and slowing banks to nudge rates higher and acting as a global growth capped yields on Government of headwind for bond returns. As a result, the fund Canada debt. Returns were boosted by an remains underweight fixed income, but less so overweight position in longer-term investment- than at previous points in the cycle. Stocks offer grade fixed income. more attractive prospects. The portfolio manager has been moderating risk-taking but the potential Global equity markets continued to fluctuate in the upside in earnings still justifies a mild overweight quarter as the trade conflict moved beyond the U. in stocks. 2018.
9 Morningstar Research Inc. All Rights Reserved. The information contained herein: (1) is proprietary to Morningstar and/or its content providers; (2) may not be copied or distributed; and (3) is not warranted to be accurate, complete or timely. Neither Morningstar nor its content providers are responsible for any damages or losses arising from any use of this information. Past performance is no guarantee of future results. These pages are not complete without the disclosure page. Printed on July 24, 2018. RBC Balanced fund Disclosure RBC Funds, BlueBay Funds, PH&N Funds and implied, are made by RBC GAM, its affiliates RBC Corporate Class Funds are offered by or any other person as to its accuracy, The fund profile is provided for informational RBC Global Asset Management Inc.
10 And completeness or correctness. All opinions purposes only. Particular investments and/or distributed through authorized dealers. and estimates constitute RBC GAM's trading strategies should be evaluated judgment as of the date of this document, are relative to each individual's investment Commissions, trailing commissions, subject to change without notice and are objectives. The information contained in the management fees and expenses all may be provided in good faith but without legal associated with mutual fund investments. responsibility. The Top Ten/25 Holdings may fund profile is not, and should not be Please read the prospectus or fund Facts change due to ongoing portfolio transactions construed as, investment or tax advice. You document before investing.