Transcription of Revenue and expenditure trends - National Treasury
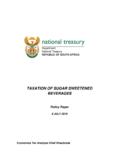
1 15 2 Revenue and expenditure trends Introduction This chapter discuss overall trends in provincial Revenue and expenditure for the seven-year period covered in the Review. Provinces play a central role in the intergovernmental system, and their performance is directly linked to the country s ability to raise living standards. The MTEF period (2014/15 2016/17) reflects government s commitment to creating jobs, growing the economy, promoting equity and accelerating access to quality services. The growth in spending is on education and skills development, improved health outcomes, integrated and sustainable human settlements, and rural development. These priorities are among the government s 14 Outcomes. Figure shows the division of nationally raised Revenue over the seven-year period. Over the MTEF period, an estimated 44 per cent of this Revenue will be transferred to provinces. Government s focus is on education, health, human settlements, rural development and sustainable job creation PROVINCIAL BUDGETS AND expenditure REVIEW: 2010/11 2016/17 16 Figure Division of nationally raised Revenue , 2010/11 2016/17 Source: 2014 Budget Review Despite rapid growth in National transfers to provinces, this has not always translated into improved service delivery.
2 The public sector therefore needs to develop a culture of efficiency, effectiveness and transparency in the use of public resources. Maintenance of infrastructure assets has to be prioritised, and training enhanced. Effective management will improve the quality of service delivery. Growth in public-sector employment and improvements in conditions of service have to be accommodated within an affordable wage bill. Revenue trends Provinces total Revenue consists of National transfers and provincial own Revenue . National transfers form the largest share and are made up of each province s equitable share and conditional grants. In 2014/15, own Revenue constituted only 3 per cent of provincial Revenue . Figure Shares of total provincial Revenue by source, 2010/11 2016/17 Source: National Treasury provincial database 100 000200 000300 000400 000500 000600 0002010/112011/122012/132013/142014/1520 15/162016/17R million National departmentsProvincesLocal government0%10%20%30%40%50%60%70%80%90% 2010/11 2011/12 2012/13 2013/14 2014/15 2015/16 2016/17 Equitable shareConditional grantsProvincial own revenueSignificant departmental spending has not always translated into improved service delivery National transfers form the largest share of provincial Revenue CHAPTER 2: Revenue AND expenditure trends 17 Provincial equitable share The equitable share is the largest source of provincial funding.
3 Provinces use it to meet basic needs including school education, health, social development and other services. The equitable share is largely determined by demographics and is redistributive towards poorer provinces. Government is committed to protecting these provincial allocations and to ensuring that spending on them is protected from inflation over the medium term. The equitable share is broadly redistributive towards poorer provinces The provincial equitable share formula The formula consists of six components that reflect the relative demand for services between provinces and take into account specific provincial circumstances. The formula s components are neither indicative budgets nor guidelines as to how much should be spent on functions in each province or by provinces collectively. Rather, the education and health components are weighted broadly in line with historical expenditure patterns to indicate relative need.
4 Provincial executive councils have discretion regarding the determination of departmental allocations for each function, taking into account the priorities that underpin the division of Revenue . For the 2014 Budget, the formula components are set out as follows: The education component (48 per cent) uses the school-age population (5 to 17 years), based on the 2011 Census, and enrolment data drawn from the 2013 School Realities Survey conducted by the Department of Basic Education. Each of these elements is assigned a weight of 50 per cent. The health component (27 per cent) uses a risk-adjusted capitation index based on the Risk Equalisation Fund and output data from public hospitals to estimate each province s share of the health component. These sub-components work together to balance needs (risk-adjusted capitation) and demands (output component). The basic component (16 per cent) is derived from the proportion of each province s share of the National population.
5 For the 2014 MTEF, population data is drawn from the 2013 Mid-Year Population Estimates produced by Statistics South Africa. The institutional component (5 per cent) recognises that some costs associated with running a provincial government and providing services are not directly related to the size of a province s population or the other factors included in other components. The poverty component (3 per cent) introduces a redistributive element to the formula. The part of the population defined as poor are those people who fall into the lowest 40 per cent of household incomes in the 2010/11 Income and expenditure Survey. The estimated size of the poor population in each province is calculated by multiplying the proportion in that province that fall into the poorest 40 per cent of South African households by the population figure for the province given in the 2013 mid-year population estimates.
6 The economic activity component (1 per cent) is a proxy for provincial tax capacity and expenditure assignments. Given that these assignments are a relatively small proportion of provincial budgets, the component is assigned a weight of 1 per cent. For the 2014 MTEF, 2011 GDP-R data is used. Source: Annexure W1 of the 2014 Budget Review PROVINCIAL BUDGETS AND expenditure REVIEW: 2010/11 2016/17 18 Table Provincial Revenue and expenditure , 2010/11 2016/172010/112011/122012/132013/142014/ 152015/162016/17R m illionOutcom e Outcom e Medium -term estim atesTransf ers f rom national325 491 362 653 387 859 416 126 444 423 477 639 508 254 of which:Equitable share265 665 291 900 312 517 339 301 362 468 387 967 412 039 Conditional grants59 826 70 753 75 343 76 825 81 955 89 672 96 215 Provincial ow n revenue10 283 12 242 13 359 14 449 13 757 14 549 15 251 Total revenue335 774 374 895 401 218 430 575 458 180 492 189 523 504 of which.
7 Unallocated conditional grants 68 197 2 864 16 692 Total expenditure331 192 368 762 394 977 424 705 454 510 484 445 499 765 Surplus(+)/deficit(-) 4 582 6 132 6 241 5 802 3 473 4 881 7 048 Share of total provincial Revenue Transf ers f rom which:Equitable ow n : National Treasury provincial database Between 2013/14 and 2016/17, the provincial equitable share is projected to have grown at an average annual rate of per cent. This is above the forecast inflation rates of per cent in 2014/15, per cent in 2015/16 and per cent in 2016/17, and should enable provinces to provide the core social services of school education, health and social development. Conditional grants Conditional grants were introduced to meet the minimum needs of specific programmes. Each conditional grant has a descriptive framework which provides information to Parliament and the public, and details the objectives and performance of each grant over its lifespan.
8 There are four main types of provincial conditional grants: Schedule 4A grants are general grants that supplement various programmes partly funded by provinces, such as infrastructure and central hospitals. Transfer and spending accountability arrangements differ, as more than one National or provincial department may be responsible for different outputs. Schedule 5A grants fund specific responsibilities and programmes implemented by provinces. Schedule 6A grants provide allocations-in-kind through which a National department implements projects in provinces. Schedule 7A grants provide for swift allocation and transfer of funds to a province to help with disaster-management. Given the challenging economic environment and fiscal constraints, government decided to reduce some underspending grants to fund key Conditional grants were introduced to meet the minimum needs of specific programmes CHAPTER 2: Revenue AND expenditure trends 19 priorities.
9 As a result, the baselines of certain conditional grants have been revised downward. However, because most of the reduced grants have a history of underspending, the impact of these reductions on service delivery is negligible. Table provides a summary of conditional grants by sector for the 2014 MTEF. Table Conditional grants to provinces, 2013/14 2016/17R million2013/142014/152015/162016/17 Agriculture, Forestry and Fisheries2 149 2 389 2 238 2 336 Comprehensive agricultural support programme 1 604 1 861 1 688 1 757 Ilima/Letsema projects 438 461 482 507 Land care programme: Poverty relief and infrastructure development106 68 68 72 Arts and Culture595 1 016 1 341 1 412 Community library services 595 1 016 1 341 1 412 Basic Education12 326 13 170 15 827 16 662 Dinaledi schools 109 111 116 122 Education infrastructure6 643 6 929 9 469 10 038 HIV and Aids (life skills education)
10 204 221 226 238 National school nutrition programme 5 173 5 462 5 704 6 006 Technical secondary schools recapitalisation 197 233 244 257 OSD for Therapists 213 67 Cooperative Governance and Traditional Affairs120 197 204 215 Provincial disaster 120 197 204 215 Health27 686 30 111 32 484 35 184 Comprehensive HIV and Aids 10 534 12 311 13 957 15 697 Health facility revitalisation5 291 5 240 5 389 5 652 Health professions training and development 2 190 2 322 2 429 2 557 National tertiary services9 620 10 168 10 636 11 200 National health insurance51 70 74 78 Higher education and training2 454 2 631 2 819 2 974 Further education and training colleges2 454 2 631 2 819 2 974 Human Settlements17 028 17 084 18 533 20 410 Human settlements development17 028 17 084 18 533 20 410 Public Works610 607 624 786 Expanded public works programme integrated for provinces354 349 357 412 Social sector expanded public works programme incentivefor provinces256 258 268 375 Social Development 29 48 48 Substance abuse treatment