Transcription of The Use of UV-visible Spectroscopy to Measure the Band Gap ...
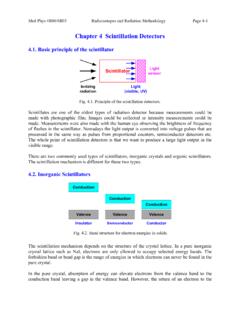
1 1 The Use of UV-visible Spectroscopy to Measure the band Gap of a Semiconductor Zhebo Chen and Thomas F. Jaramillo Department of Chemical Engineering, Stanford University Edited by Bruce Brunschwig 09/19/2017 Section 1: Introduction to UV-Vis Spectroscopy In ultraviolet-visible light (UV-vis) spectroscopic, light absorption is measured as a function of wavelength. The spectrum provides information about electronic transitions occurring in the material. The Beer-Lambert law states that the Transmittance, , the light transmitted (IT) over the incident intensity (I0), is dependent on the path length of the light through the sample (l), the absorption cross section (s) of the sample s transition, and the difference in the population of the initial state (Nl) and final state (N2), Equation ( ) This is often written in a form referred to as Beer's Law, equation or ( ) where A, is the absorbance, e is the molar absorptivity coefficient of the material, c is the concentration of the absorbing species, and l is the path length of the light through the sample.
2 The absorbance A can be normalized to the path length l of the light through the material ( , the thickness of a film), producing the absorption coefficient a1 ( ) T=ITIo=exp( (N1 N2)l A= cl= log10 ITI0 IT=I010 cl (cm 1)=ln(10) Al(cm)=ln(10) c 2 or ( ) The "efficiency" of the photon absorption process occurring within a sample, formally known as absorptance, fA (this is different from absorbance), is defined as the fraction of photons absorbed per photons impinging on the sample assuming there is no reflection from the sample (see below Eq ) where Iabs is the light absorbed. !=I" # "=1 = $%& "=1 10'! ( ) For semiconductors, UV-vis Spectroscopy offers a convenient method of estimating the optical band gap, since it probes electronic transitions between the valence band and the conduction band . The optical band gap is not necessarily equal to the electronic band gap, which is defined as the energy difference between the valence band minimum (VBM) and the conduction band maximum (CBM); however, it is often approximated as such because there are few convenient methods for measuring the electronic band gap.)
3 Exciton binding energies, d-d transitions, phonon absorption and emissions, and excitations to or from defect bands and color centers can complicate interpretation of UV-vis spectra; nevertheless, an estimation of the optical band gap is obtainable. Furthermore, UV-vis allows for the characterization of this electronic transition as either direct or indirect and whether it is allowed or forbidden. A direct transition is described as a two-particle interaction between an electron and a photon, whereas an indirect transition is described as a three-particle interaction (photon, electron, phonon) to ensure momentum conservation. A transition is allowed or forbidden depending on the dipole selection rules associated with the system. The shape of the UV-vis absorption spectrum can distinguish between these transitions. Section 2: Limitations of UV-vis Spectroscopy The UV-vis measurement is relatively straightforward, and the data obtained is highly reproducible from lab to lab despite differences in lamp sources, spectrometers, experimental configuration, etc.
4 However, to derive a band gap value from a UV-vis measurement, the data must be interpreted. Interpretation is often made difficult by the shape of the absorption spectrum and the ability of the user to estimate the line tangent to l= lnITI0 IT=I0exp( l) 3 the slope of the absorption data. This procedure requires the drawing of a tangent line to the curve, which is subjective and can result in significant error. The absorption edge in many materials is characterized by an exponential tail with values of a < ~ 104 , 3 Fitting a tangent to a point within this tail will underestimate the band gap of the material, as seen in Figure 1. Damage to the working sample does not typically occur in UV-vis spectroscopic measurements unless the lamp exhibits particularly intense irradiation in the infrared that could locally heat the sample.
5 The user can correct for this by using a water jacket to attenuate the intensity of these peaks. The possibility of degradation from high energy UV radiation also exists, which can be particularly problematic in samples involving organics. Figure 1 Direct (allowed) band gap Tauc plot (solid black) and absorption coefficient (solid red) plot of MoS2. Extrapolation of (ahn)2 to the x-intercept using the low energy exponential tail region results in an underestimate of the band gap (dashed blue and dashed orange). In this case, the correct trend line {dashed black) is drawn when fitted to values of a > x l04 cm-1. 4 Other sources of error in a UV-vis measurement often arise from reflection, refraction, or scattering that may occur at the surface and interfaces of the material or from the unwanted transmission of light during a diffuse reflectance experiment.}
6 These effects decrease the amount of light that reaches the detector and produce seemingly higher absorption values. This can result in nonzero baselines or sloped base lines that need to be considered when analyzing spectra. To minimize reflection or refraction during a transmission experiment, the user should ensure that the sample sits normal to the path of incident light. Scattering effects can be minimized by placing the sample as close as possible to the detector. In a diffuse reflectance measurement, the user should place a highly reflective standard against a transparent sample to decrease transmitted light. Pitfalls of the experimental procedure often come from an improperly positioned sample, as mentioned above, or from measurements performed before the lamp has had proper time to warm up, resulting in an unreliable base line. Improper shielding of the sampling chamber from ambient lighting can also contribute to the background signal and decrease the signal-to-noise ratio.
7 Lastly, harmonics that arise from using a grating monochromator can lead to inaccurate measurements if they are not removed using long-pass-filters. Section 3: Experiment methods for UV-vis spectroscopic measurements The two most used UV-vis configurations are transmission and diffuse reflectance, each of which will be further discussed in detail. Both techniques follow the general experimental format: Turn on lamp source and allow at least 15 minutes for lamp to warm up Place reference sample into the light path Collect a baseline of the reference sample and, if available, a dark scan Place working sample into the light path Collect transmission/reflection spectrum of working sample Calculate the absorption coefficient and convert wavelength in nm to eV Fit the spectrum to estimate the band gap and assess whether it is direct or indirect and whether it is forbidden or allowed 5 There is little preparation time involved in a UV-vis spectroscopic measurement other than the effort required to place the sample in a proper sample holder for the instrument.
8 The amount of time required to conduct the experiment is minimal and mostly determined by the time required for the lamp to warm up. Sampling time will vary depending on the speed and range of the scan but generally takes no more than a few minutes. Analysis time is similarly short, requiring no more than a few minutes to plot and analyze the data in a program. Section : Experimental Parameters The experimentalist must first decide between using a transmission or diffuse reflectance configuration. In general, transmission mode is used for transparent samples. Often these materials are single crystals or thin films supported on transparent glass substrates. Opaque or translucent samples, such as materials supported on metallic substrates or solids made up on small particles or multiple small crystals, cannot be used since they strongly scatter light and in transmission mode the spectrometer would indicate complete absorption across all wavelengths of light.
9 As such, opaque samples must utilize a diffuse reflectance configuration. However, a diffuse reflectance configuration can also be used for transparent samples if a reflectance standard is placed behind the sample to reflect all transmitted light back through the sample and into the integrating sphere as shown in Figure 5. It is beneficial to utilize the full wavelength range of the UV-vis spectrometer to Measure a more reliable baseline and absorption plateau. Because the sampling time is typically short, choosing a smaller range does not provide a significant decrease in the time required to perform the measurement. However, two situations may arise that require a decreased range of measurement. If the sample is particularly sensitive to local heating from absorbing infrared radiation, then it may be beneficial to limit the spectrometer to wavelengths below -800 nm.
10 If the sample degrades from high energy UV radiation, then limiting wavelengths to above - 400 nm may be required, although the exact cut-off is dependent on the material. Section : Transmission UV-vis. 6 In transmission configuration, the user places the sample of interest, hereby referred to as the working sample, in the path of a collimated beam of light. Samples must have at least a small degree of transparency. The light passes through the working sample and is partially absorbed at characteristic wavelengths corresponding to electronic transitions in the sample. A spectrometer collects the transmitted light and compares the output against a baseline reference measurement corresponding to l 00% T (or 0 A). The reference measurement must consider the absorbance by any material support, such as a cuvette holder or a glass slide. Transmission reference measurements can be accomplished using either a single or double-beam setup.