Transcription of USING CONCEPT MAPS IN QUALITATIVE RESEARCH
1 CONCEPT Maps: Theory, Methodology, Technology Proc. of the First Int. Conference on CONCEPT Mapping Pamplona, Spain 2004 USING CONCEPT MAPS IN QUALITATIVE RESEARCH Barbara J. Daley, University of Wisconsin Milwaukee Email: ~bdaley Abstract. Despite the huge increase in the number of QUALITATIVE RESEARCH studies conducted, USING CONCEPT maps as a methodological RESEARCH strategy has received little attention in recent literature. This paper will discuss the connections between QUALITATIVE RESEARCH and CONCEPT maps. Additionally, four strategies for incorporating CONCEPT maps in QUALITATIVE RESEARCH will be presented along with sample maps for each strategy. Finally, advantages and disadvantages of USING CONCEPT maps in QUALITATIVE RESEARCH will be discussed. 1 Introduction QUALITATIVE RESEARCH as a form of inquiry has grown tremendously in the last decade. The number and quality of QUALITATIVE studies in almost every discipline has increased.
2 In addition, sophisticated computerized software programs have been developed to assist with the data analysis process in QUALITATIVE inquiry. The focus of QUALITATIVE RESEARCH tends to be on understanding the meaning imbedded in participant experiences through an open-ended, unstructured and subjective approach (Lincoln & Guba, 1985). The RESEARCH is most often conducted in a naturalistic setting with a purposive sample (Patton, 2002). The RESEARCH tends to be holistic, descriptive and focuses on the depth and details of experiences (Denzin & Lincoln, 1998). Data collection methods include interviews, observations, field notes, and documents to name a few (Wolcott, 1994). Data tend to be analyzed through an inductive, ongoing and evolving process of identifying themes within a particular context (Miles & Huberman, 1994). As Creswell (1998) indicates, QUALITATIVE RESEARCH is an inquiry process of understanding based on distinct methodological traditions of inquiry that explore a social or human problem.
3 The researcher builds a complex, holistic picture, analyzes words, reports detailed views of informants and conducts the study in a natural setting (p15). Challenges in QUALITATIVE RESEARCH Researchers engaged in QUALITATIVE inquiry find varying challenges in the process. Often these challenges have to do with the data analysis process. In QUALITATIVE inquiry, researchers need to take voluminous amounts of text-based data and reduce that data to a manageable form without loosing the embedded meaning. Additionally, QUALITATIVE researchers are challenged to make the process they use in data analysis transparent. Often QUALITATIVE studies describe the data analyses as a process of reading and re-reading transcripts until themes emerge. This type of description makes it difficult for subsequent researchers to understand not only the analysis process, but to understand where and how the findings have emerged from the data. If readers can not rely on the credibility and trustworthiness (Lincoln & Guba, 1985) of the analysis process, then the findings from QUALITATIVE studies tend to become suspect.
4 CONCEPT maps can provide one strategy to deal with the methodologic challenges of QUALITATIVE RESEARCH . A CONCEPT map (Novak, 1998) can be used to frame a RESEARCH project, reduce QUALITATIVE data, analyze themes and interconnections in a study, and present findings. A CONCEPT map is a schematic device for representing a set of CONCEPT meanings embedded in a framework of propositions (Novak and Gowin, 1984, p. 15). CONCEPT maps are created with the broader, more inclusive concepts at the top of the hierarchy, connecting through linking words with other concepts than can be subsumed. CONCEPT maps are an important strategy in QUALITATIVE inquiry because they help the researcher focus on meaning. The maps allow the researcher to see participants meaning, as well as, the connections that participants discuss across concepts or bodies of knowledge. Additionally, the maps support researchers in their attempts to make sure that QUALITATIVE data is embedded in a particular context.
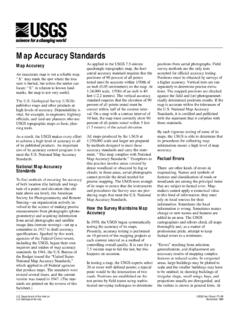
5 Since the maps focus on subsumption, progressive differentiation, and integrative reconciliation of concepts (Novak & Gowin, 1984) the RESEARCH context remain an integral part of the data analysis process. The remainder of this paper will focus on examples of how CONCEPT maps can be used in QUALITATIVE studies. 2 Mapping and Methods Framing RESEARCH Projects CONCEPT maps can be used to frame or plan RESEARCH projects. For example, the first map shown in Figure 1 was used to plan a RESEARCH study investigating how the use of CONCEPT maps impacted the learning of adult students in higher education over two semesters. Figure 1: Applying the Scholarship of Teaching and Learning: Understanding Adult Students in Higher Education Part of the purpose of this RESEARCH was to link the study to the eight principles of the scholarship of teaching and learning (SOTL). ( ). So in planning the study, these eight principles were presented (note blue concepts)
6 On the CONCEPT map and the actual RESEARCH includesincludesincludesincludesleading toincludesandleading tosuch asdecreasing thus needto promoteandleads to such asidentifies need tothentoand completeincludessuch assuch asrelies onchange over timeincludingofofto impactScholarship of Teaching and LearningSystematic inquiry into teaching and learning issuesCritical reflection on strategies, techniques, possibilitiesApplication of results of reflection to practiceAssessment of resultsPublic communication/dissemination of reflection and resultsSelf-reflectionPeer ReviewDemonstrable productsAdults use rote learningEffectiveness in LearningDevelopment of constructivist learning strategiesLearning how learnCritical thinkingTeach CONCEPT maps as learning toolCompare C-maps at beginning and end of each semesterFollow students for a yearTwo interviews Teacher journal project was linked to each of the eight principles (Daley, 2002). This map clearly depicted for other researchers how the SOTL principles were incorporated through out the RESEARCH project.
7 In planning RESEARCH projects the maps serve the purpose of helping researchers to link the conceptual framework of the RESEARCH to the actual RESEARCH methods. Reducing Data One of the strengths of USING CONCEPT maps in QUALITATIVE RESEARCH is that it allows the researcher to reduce the data in a meaningful way. By USING maps it is possible to display an average 20 page interview transcript on a single page. USING CONCEPT maps in the data reduction process, allows for the visual identification of themes and patterns. It also allows the researcher to capture meaning of the participant interviews because the maps display concepts in both a horizontal and vertical fashion. It is these linkages that facilitate the process of understanding interconnections and meanings in the data. The vertical linkages display how the participant differentiated concepts and the horizontal linkages display how the participant connected and related different areas of the study.
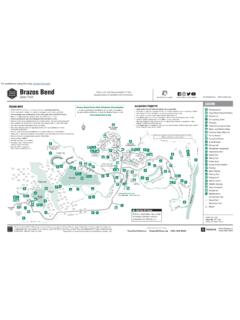
8 In addition, reducing QUALITATIVE data to a one page CONCEPT map can facilitate the process of cross-site or cross-group analysis. Sorting the one page maps by groups or sites can facilitate the process of comparing for similarities or highlighting differences. For example, in a study of how different professionals learn in their practice, CONCEPT maps were created of each interview. This allowed researchers to compare how nurses, adult educators, social workers, and lawyers learned (Daley, 2001). Analyzing Themes CONCEPT maps also can be used as a strategy to search out and analyze themes in QUALITATIVE RESEARCH . To identify these overarching themes requires that researcher identify interconnections between concepts. If the researcher is searching for specific interconnections, a CONCEPT map can be created from the interview transcript that demonstrates these connections. For example, in one study on how professionals learn the researcher was looking for the connections participants made between what they learned in formal continuing education programs and their professional practice.
9 So CONCEPT maps were created of each interview the depicted what participants said about their knowledge from continuing education, the context in which they worked and their professional practice. Figure 2 depicts the connections one participant, a social worker, in this study made. The map displayed here is difficult to read because of the complexity, and yet the interconnections are clear. At the top of this map are the concepts of knowledge, context and professional practice (in blue). The interconnections that the interview participant discussed are displayed in pink. The social worker in this interview had been to a continuing education program on long-term care issues. From the map, one can see that when returning to work she did share the content of the workshop with her supervisor. Additionally, she clarified how she could use this information in counseling clients. CONCEPT maps can also be used to help create a category or coding system in QUALITATIVE RESEARCH .
10 After the maps are created from each interview or observation, the researcher can go through these maps looking for levels of hierarchy, interconnections and repeated concepts. These items then may indicate emerging themes. The category system created can then be used in conjunction with computerized QUALITATIVE data analysis packages. Once the category system is created the actual data can be coded and CONCEPT maps can even be linked or tagged to individual data samples. Again this linking and tagging helps to keep the participant meaning and RESEARCH context central in the data analysis process. CPE in the ProfessionsKnowledgeCon textHuman Reso urce sPoliticalStructuralSym bolicProfessional practiceProfessional backgroundEAP programcounseling serviceselder careNASW conference networkingupdatelocal to professional associationlong term care in WIproper reporting and record keepingpresented boss with info from thishelped us see how we fitwhole philosophysounds like W2struck me as being interestingwhole element of the redesignsound helpfulhave not used the info yetmore putting finger on pulse of what is going on in WIwas not a skill programis motivationalfeel prideglad to be a social workermet a person I may want to hireresource coordinatorDir.