Example: confidence
Using ODS to Generate Excel Files - SAS Technical Support
Using ODS to Generate Excel Files Chevell Parker Introduction ... that the formatting is preserved in the Excel file. If you do not use PROC Template to generate a style, the default style is used and carried forward to the Excel file. The
Tags:
Information
Domain:
Source:
Link to this page:
Documents from same domain

027-2009: Tips and Tricks for Creating the Reports …
support.sas.comPaper 027-2009 TIPS AND TRICKS FOR CREATING THE REPORTS YOUR CLIENTS NEED TO SEE Michael J Molter, INC Research, Raleigh, NC ABSTRACT Advanced reporting tools such as PROC REPORT have progressed by leaps and …

Step-by-Step Programming with Base SAS Software
support.sas.comThe correct bibliographic citation for this manual is as follows: SAS Institute Inc. 2001. Step-by-Step Programming with Base SAS® Software.Cary, NC: SAS Institute Inc.

227-2012: Executing a PROC from a DATA Step - …
support.sas.com2 Using RUN_MACRO to execute a PROC from a DATA step requires writing three blocks of code, described in the Introduction: a macro to execute a PROC, a user-written function to execute the macro, and a DATA step to call the

149-2012: Queries, Joins, and WHERE Clauses, Oh …
support.sas.comPaper 149-2012 Queries, Joins, and WHERE Clauses, Oh My!! Demystifying PROC SQL Christianna S. Williams, Chapel Hill, NC ABSTRACT Subqueries, inner joins, outer joins, HAVING expressions, set operators…just the terminology of PROC SQL might

158-2010: How to Use Arrays and DO Loops: Do I …
support.sas.com1 Paper 158-2010 How to Use ARRAYs and DO Loops: Do I DO OVER or Do I DO i? Jennifer L Waller, Medical College of Georgia, Augusta, GA ABSTRACT

248-2009: Learning When to Be Discrete: …
support.sas.com1 Paper 248–2009 Learning When to Be Discrete: Continuous vs. Categorical Predictors David J. Pasta, ICON Clinical Research, San Francisco, CA ABSTRACT

338-2011: An Introduction to Survival Analysis …
support.sas.com2 (Censored) Study Ends (From Applied Survey Data Analysis, p. 306) Figure 1. Prospective View of Event History Survey Data Time can be regarded as continuous or discrete and this basic distinction affects the analytic approach selected.

Dongsheng Yang and Jarrod E. Dalton - SAS
support.sas.com1 Paper 335-2012 A unified approach to measuring the effect size between two groups using SAS® Dongsheng Yang and Jarrod E. Dalton Departments of Quantitative Health Sciences and Outcomes Research

SAS/STAT 9.2 User's Guide: Introduction to Power …
support.sas.comSAS/STAT ® 9.2 User’s Guide Introduction to Power and Sample Size Analysis (Book Excerpt) SAS® Documentation

249-2012: A Tutorial on the SAS® Macro Language
support.sas.com1 Paper 249-2012 A Tutorial on the SAS® Macro Language John J. Cohen, Advanced Data Concepts LLC, Newark, DE ABSTRACT The SAS macro language is another language layering on top of regular SAS code.
Related documents

USING EXCEL SOLVER IN OPTIMIZATION PROBLEMS
archives.math.utk.eduwe demonstrate how to use Excel spreadsheet modeling and Solver to find the optimal solution of optimization problems. If the model has two variables, the graphical method can …
RESAMPLING USING EXCEL IN TEACHING STATISTICS
archives.math.utk.edu3. Sampling Distribution Using Excel Data Table Now we use Excel Data Table to generate the sampling distribution of mean and introduce the concepts.
Formulas & Functions in Microsoft Excel
biostat.mc.vanderbilt.eduExcel is a great tool to use for data collection and entry, and even to use for some derivation of other columns. However, Excel IS NOT the best tool to use to conduct advanced analyses, especially statistical analyses.

How to Use Excel for Data Entry - University of California ...
eds-courses.ucsd.eduExcel is a very popular tool for entering and manipulating data. This document shows you how to enter data that you can easily open in statistics packages such as SPSS or SAS.
Time Value of money using Excel - KFUPM
faculty.kfupm.edu.saTime Value of money using Excel Future Value calculations 1- Open Excel 2- Go to (Insert) tap 3- Choose (Function) 2 4- In the (insert function) box ... When the function argument box open, use the cell selector button to choose the relevant variables. 20 For cash …
Using Excel to Solve Business Problems - AI Applications
vaultanalytics.comPreparing to Use Excel 2007 Excel 2007 is used in the specific ‘How To’ sections, as it is the most ubiquitous piece of software with statistical capabilities.

Creating a Gradebook in Excel
eds-courses.ucsd.eduCreating a Gradebook in Excel Spreadsheets are a great tool for creating gradebooks. With a little bit of work, you can create a customized gradebook that will provide weighted scores and averages. The following instructions describe the steps for creating a spreadsheet gradebook.
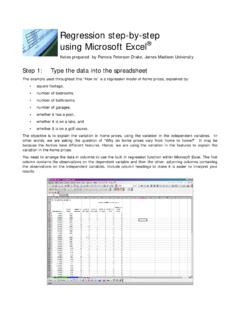
Regression step-by-step using Microsoft Excel
educ.jmu.eduStep 2: Use Excel®’s Data Analysis program, Regression In the Tools menu, you will find a Data Analysis option.1 Within Data Analysis, you should then choose Regression: Step 3: Specify the regression data and output You will see a pop-up box for the regression specifications.
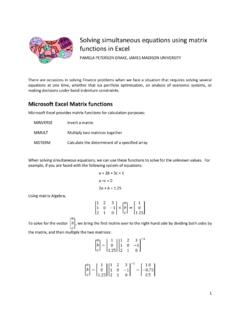
Solving simultaneous equations using matrix functions in Excel
educ.jmu.eduMicrosoft Excel provides matrix functions for calculation purposes: MINVERSE Invert a matrix MMULT Multiply two matrices together MDTERM Calculate the determinant of a specified array When solving simultaneous equations, we can use these functions to solve for the unknown values. For

Using Excel to Graph a Function - San Dieguito Union High ...
math.sduhsd.netUsing Excel to Graph a Function 1. Make the x-values. a. Type x in cell A1. b. Type 1 in cell A2 and type 2 in cell A3. c. Select cells A2 and A3 by clicking-and-dragging. Select the “formula drag” point in the lower right corner of the selection and drag this down until you have the values 1 through 15 showing.
Related search queries
USING EXCEL SOLVER IN OPTIMIZATION PROBLEMS, How to use Excel, RESAMPLING USING EXCEL IN TEACHING STATISTICS, Excel, Use Excel, Formulas & Functions in Microsoft Excel, How to Use Excel for Data Entry, Using Excel to Solve Business Problems, Creating a Gradebook in Excel, Using Excel to Graph a Function