
PD1: Plot Diagram
Plot Diagram must show the correct street lines from the City Plan; the plot to be built upon in relation to the street lines and the portion of the lot to be occupied by the building; the legal grades and the existing grades, properly identified, of streets at nearest point from the proposed buildings
Download PD1: Plot Diagram

Information
Domain:
Source:
Link to this page:
Documents from same domain
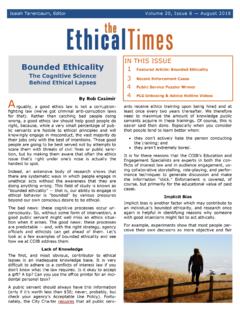
IN THIS ISSUE When Good Intentions - Welcome to …
www1.nyc.gova 501(c)(3) organization committed to neighborhood-based HIV prevention and treatment. If selected, the funding and assistance would be used to construct a

HIV SURVEILLANCE ANNUAL REPORT, 2016 - nyc.gov
www1.nyc.govhiv surveillance annual report, 2016. hiv surveillance new york city department of health and mental hygiene
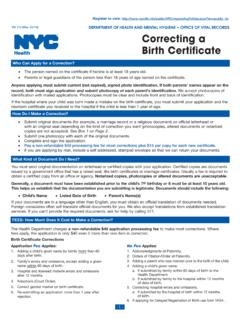
Correcting a Birth Certificate - City of New York
www1.nyc.govDEPARTMENT OF HEALTH AND MENTAL HYGIENE † OFFICE OF VITAL RECORDS Correcting a Birth Certificate Who Can Apply for a Correction? How Do I …

A PARKING TICKET OR CAMERA VIOLATION?
www1.nyc.govyour ticket pay OR DISPUTE There are a few ways to pay or dispute your ticket. If your ticket was printed by machine, information is available on our website within a few days.
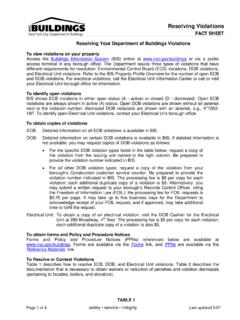
New York City Department of Buildings FACT SHEET
www1.nyc.govNew York City Department of Buildings Resolving Violations FACT SHEET Page 1 of 4 safety • service • integrity Last updated 5/07 Resolving Your Department of …
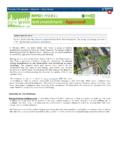
Projects & Proposals Citywide Zone Green
www1.nyc.govProjects & Proposals > Citywide Zone Green Frequently Asked Questions . General Questions Q: How does this proposal relate to the Greener, Greater Buildings Plan and other City efforts to improve building performance?

Design Professional Guide for New Building and …
www1.nyc.govBill de Blasio, Mayor Development Hub@buildings.nyc.gov Rick D. Chandler, P.E., Commissioner nyc.gov/buildings
Supplemental Nutrition Assistance Program (SNAP ...
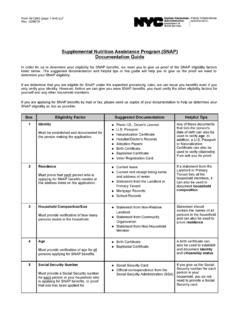
www1.nyc.govForm W-129G (page 1 of 4) LLF Rev. 12/08/15 Supplemental Nutrition Assistance Program (SNAP) Documentation Guide In order for us to determine your eligibility for SNAP benefits, we need you to give us proof of the SNAP eligibility factors
NYC Energy Conservation Code
www1.nyc.govBill de Blasio Mayor nyc.gov/buildingsRick D. Chandler, PE Commissioner Version 1 | 06.2015. NYC Energy Conservation Code . Commercial Alterations . Photo: Samantha Modell
Foundations - Welcome to NYC.gov
www1.nyc.govFOUNDATIONS build safe |live safe 2.2017 | page 2 of 8 A foundation is the element that anchors a structure and transfers loads from the structure to the ground. Foundatio
Related documents
Basic Graphics in R - Harvard University
bcb.dfci.harvard.eduPlot of data.frame elements If the rst argument to plot() is a data.frame, this can be as simply as plot(x,y) providing 2 columns (variables in the data.frame). Lets look at the data in the data.frame airquality which measured the 6 air quality in New
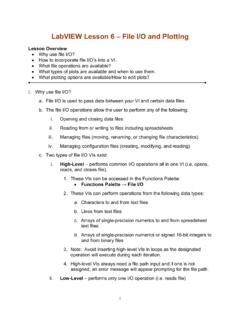
LabVIEW Lesson 6 – File I/O and Plotting
boson.physics.sc.eduLabVIEW Lesson 6 – File I/O and Plotting Lesson Overview • Why use file I/O? ... File I/O formats depend on the type of files being used. 3 types of formats exist: text, binary, and datalog. ... the plot lines, the type of data points (useful when plotting multiple sets of data), and many other options. ...

Using SAS’s PROC GPLOT to plot data and lines
cob.jmu.eduUsing SAS’s PROC GPLOT to plot data and lines PROC GPLOT creates “publication quality” color graphics which can easily be exported into documents, presentations, etc. To export the graphs for future use click on file, export. In the dialog box choose a

Basic Plotting with Python and Matplotlib
courses.csail.mit.eduThe basic syntax for creating line plots is plt.plot(x,y), where x and y are arrays of the same length that specify the (x;y) pairs that form the line. For example, let’s plot the cosine function from 2 to 1.

PLOTTING AND GRAPHICS OPTIONS IN MATHEMATICA
dslavsk.sites.luc.eduPLOTTING AND GRAPHICS OPTIONS IN MATHEMATICA In addition to being a powerful programming tool, Mathematica allows a wide array of plotting and graphing options. We will look at a variety of these, starting with the Plot command. ... Plot x, x^2, x^3, x ...

Unit 9 Describing Relationships in Scatter Plots and Line ...
lycofs01.lycoming.edu56 Unit 9 Describing Relationships in Scatter Plots and Line Graphs Objectives: • To construct and interpret a scatter plot or line graph for two quantitative variables
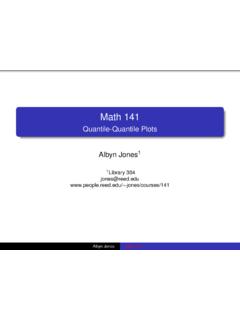
Math 141 - Quantile-Quantile Plots
people.reed.eduThe QQ plot The quantile–quantile plot, or QQplot, is a simple graphical method for comparing two sets of sample quantiles. Plot the pairs of order statistics (X (k);Y (k)): If the two datasets come from the same distribution, the points ... Math 141 - Quantile-Quantile Plots ...

Plotting functions of more than one variable with Mathematica
physics.weber.eduPlotting functions of more than one variable with Mathematica Physics 3510, Weber State University This tutorial assumes that you are already somewhat familiar with Mathematica.

Split Plots - Statistics
users.stat.umn.eduAll split plots in the same whole plot get the same level of the whole plot treatment factor. All levels of the split plot treatment factor occur in each whole plot. The restricted randomization is equivalent to the two randomizations of the unit structure approach.
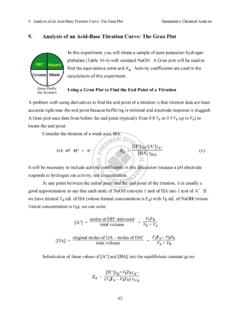
9. Analysis of an Acid-Base Titration Curve: The Gran Plot
web.mnstate.eduThe Gran plot in the acidic region gives accurate results even if there is CO2 dissolved in the strong base titrant. The Gran plot in the basic region can be used to measure CO2 in the strong base. For completeness, we note that if weak base, B, is titrated with a strong acid, the Gran
Related search queries
Basic Graphics in R, Plot, Lesson 6, File I/O, The Plot, Using SAS’s PROC GPLOT to plot data, Basic Plotting with Python and Matplotlib, PLOTTING AND GRAPHICS OPTIONS IN, Describing Relationships in Scatter Plots, Math 141 - Quantile-Quantile Plots, Plotting functions of more than one variable with Mathematica, Split plots, Gran plot