Transcription of Debugger Basics - Training - Lauterbach
1 Debugger Basics - Training 1 1989-2018 Lauterbach GmbHDebugger Basics - TrainingTRACE32 Online Help TRACE32 Directory TRACE32 Index TRACE32 Training .. Debugger Training .. Debugger Basics - Training ..1 System Concept ..5 On-chip Debug Interface6 Debug Features6 TRACE32 Tools7 On-chip Debug Interface plus On-chip Trace Buffer9 On-chip Debug Interface plus Trace Port11 NEXUS Interface12 Starting a TRACE32 PowerView Instance ..13 Basic TRACE32 PowerView Parameters13 Configuration File13 Standard Parameters14 Examples for Configuration Files15 Additional Parameters19 Application Properties (Windows only)20 Configuration via T32 Start (Windows only)21 About TRACE3222 Version Information22 Prepare Full Information for a Support Email23 Establish your Debug Session.
2 24 TRACE32 PowerView ..25 TRACE32 PowerView Components25 Main Menu Bar and Accelerators26 Main Tool Bar28 Window Area30 Command Line33 Message Line36 Softkeys37 State Line38 Registers ..39 Core Registers39 Debugger Basics - Training 2 1989-2018 Lauterbach GmbH Display the Core Registers39 Colored Display of Changed Registers40 Modify the Contents of a Core Register41 Special Function Register42 Display the Special Function Registers42 Details about a Single Special Function Register45 Modify a Special Function Register46 The PER Definition File47 Memory Display and Modification.
3 48 The Window49 Display the Memory Contents49 Modify the Memory Contents54 Run-time Memory Access55 Colored Display of Changed Memory Contents65 The List Window66 Displays the Source Listing Around the PC66 Displays the Source Listing of a Selected Function67 Breakpoints ..69 Breakpoint Implementations69 Software Breakpoints in RAM69 Software Breakpoints in FLASH70 Onchip Breakpoints in NOR Flash71 Onchip Breakpoints on Read/Write Accesses74 Onchip Breakpoints by Processor Architecture75 ETM Breakpoints for ARM or Cortex-A/-R87 Breakpoint Types89 Program Breakpoints90 Read/Write Breakpoints92 Breakpoint Handling.
4 94 Breakpoint Setting at Run-time94 Real-time Breakpoints vs. Intrusive Breakpoints95 Dialog Box97 The HLL Check Box - Function Name98 The HLL Check Box - Program Line Number100 The HLL Check Box - Variable101 The HLL Check Box - HLL Expression103 Implementations104 Actions105 Options109 DATA Breakpoints113 Advanced Breakpoints117 TASK-aware Breakpoints118 Debugger Basics - Training 3 1989-2018 Lauterbach GmbH Intrusive TASK-aware Breakpoint118 Real-time TASK-aware Breakpoint121 COUNTer122 Software Counter122 On-chip Counter125
5 COND ition126 CMD134 memory/register/var137 Display a List of all Set Breakpoints142 Delete Breakpoints143 Enable/Disable Breakpoints143 Store Breakpoint Settings144 Debugging ..145 Debugging of Optimized Code145 Basic Debug Control148 Sample-based Profiling ..160 Program Counter Sampling160 Standard Procedure161 Details165 TASK Sampling167 Debugger Basics - Training 4 1989-2018 Lauterbach GmbHDebugger Basics - TrainingVersion 16-Nov-2018 Debugger Basics - Training 5 1989-2018 Lauterbach GmbHSystem ConceptA single-core processor/multi-core chip can provide: An on-chip debug interface An on-chip debug interface plus an on-chip trace buffer An on-chip debug interface plus an off-chip trace port A NEXUS interface including an on-chip debug interfaceDepending on the debug resources different debug features can be provided and different TRACE32 tools are offered.
6 Debugger Basics - Training 6 1989-2018 Lauterbach GmbHOn-chip Debug InterfaceThe TRACE32 Debugger allows you to test your embedded hardware and software by using the on-chip debug interface. The most common on-chip debug interface is single on-chip debug interface can be used to debug all cores of a multi-core FeaturesDepending on the processor architecture different debug features are features provided by all processor architectures: Read/write access to registers Read/write access to memories Start/stop of program executionDebug features specific for a processor architecture: Number of on-chip breakpoints Read/write access to memory while the program execution is running Additional features as benchmark counters, triggers etc.
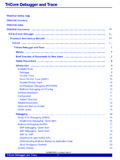
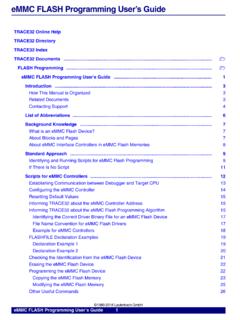
7 Debugger Basics - Training 7 1989-2018 Lauterbach GmbHTRACE32 ToolsThe TRACE32 Debugger hardware always consists of: Universal Debugger hardware Debug cable specific to the processor architecture Debug Only ModulesCurrent module: POWER DEBUG INTERFACE / USB 3 Deprecated module: POWER DEBUG INTERFACE / USB 2 TargetDEBUG CABLELAUTERBACHD ebug CablePOWER DEBUG INTERFACE / USB 3AC/DC AdapterPCUSBC ableLAUTERBACHPOWERSELECTEMULATEPODBUS OUTUSBPODBUS INDEBUG CABLEPOWER7-9 VTRIGPOWER DEBUG USB INTERFACE / USB 3 JTAGC onnectorWindows / Linux / Mac OS Debugger Basics - Training 8 1989-2018 Lauterbach GmbHDebug Modules with Option for Off-chip Trace Extension Current module: POWER DEBUG PRO (USB 3 and 1 GBit Ethernet)Deprecated modules: POWER DEBUG II (USB 2 and 1 GBit Ethernet) POWER DEBUG / ETHERNET (USB 2 and 100 MBit Ethernet)TargetDebug CablePOWER DEBUG PROAC/DC AdapterEthernetCableDEBUG CABLELAUTERBACHLAUTERBACHPOWERSELECTRUNN INGPODBUS OUTETHERNETUSBPODBUS SYNCDEBUG CABLEPODBUS EXPRESS OUTPOWER7-9 VTRIGGERPOWER DEBUG PROHUBPC orWorkstation1 Gbit EthernetJTAGC onnector Debugger Basics - Training 9 1989-2018 Lauterbach GmbHOn-chip Debug Interface plus On-chip Trace BufferA number of single-core processors/multi-core chips offer in addition to the on-chip debug interface an on-chip trace Trace FeaturesThe on-chip trace buffer can store information.
8 On the executed instructions. On task/process switches. On load/store operations if supported by the on-chip trace generation order to analyze and display the trace information the debug cable needs to provide a Trace License. The Trace Licenses use the following name convention: <core>-TRACE ARM-TRACE or <core>-MCDS) TriCore-MCDS Debugger Basics - Training 1 0 1989-2018 Lauterbach GmbHThe display and the evaluation of the trace information is described in the following Training manuals: ARM-ETM Training ( ). AURIX Trace Training ( ). Hexagon-ETM Training ( ). Nexus Training ( ). Debugger Basics - Training 1 1 1989-2018 Lauterbach GmbHOn-chip Debug Interface plus Trace PortA number of single-core processors/multi-core chips offer in addition to the on-chip debug interface a so-called trace port.
9 The most common trace port is the TPIU for the ARM/Cortex Trace FeaturesThe trace port exports in real-time trace information: On the executed instructions. On task/process switches. On load/store operations if supported by the on-chip trace generation display and the evaluation of the trace information is described in the following Training manuals: ARM-ETM Training ( ) AURIX Trace Training ( ) Hexagon-ETM Training ( ) Debugger Basics - Training 1 2 1989-2018 Lauterbach GmbHNEXUS InterfaceNEXUS is a standardized interface for on-chip debugging and real-time trace especially for the automotive FeaturesDebug features provided by all single-core processors/multi-core chips: Read/write access to the registers Read/write access to all memories Start/stop of program execution Read/write access to memory while the program execution is runningDebug features specific for single-core processor/multi-core chip: Number of on-chip breakpoints Benchmark counters, triggers features provided by all single-core processors/multi-core chips: Information on the executed instructions.
10 Information on task/process features specific for the single-core processor/multi-core chip: Information on load/store operations if supported by the trace generation display and the evaluation of the trace information is described in Nexus Training ( ). Debugger Basics - Training 1 3 1989-2018 Lauterbach GmbHStarting a TRACE32 PowerView InstanceBasic TRACE32 PowerView ParametersThis chapter describes the basic parameters required to start a TRACE32 PowerView parameters are defined in the configuration file. By default the configuration file is named It is located in the TRACE32 system directory (parameter SYS).Configuration FileOpen the file from the system directory (default c:\T32\ ) with any ASCII following rules apply to the configuration file: Parameters are defined paragraph by paragraph.