Example: bachelor of science
Drafting the Light Plot - Cornell University
VectorWorks 2009 Tutorial - Drafting the Light Plot 8 Fig. 5 In the Resources Browser make sure “VWTutrlLtPlot” is the active file and the ElectricLong is the active symbol.{Fig. 6}
Tags:
Information
Domain:
Source:
Link to this page:
Documents from same domain

To: Sharon Ahlers - Cornell University
courses.cit.cornell.eduThe Bay Area Rapid Transit (BART) incident is sometimes seen as a case of three ethical engineers trying to protect the public in the face of unresponsive managers. In this interpretation, the engineers identify an important and real
A Theory of Justice - Cornell University
courses.cit.cornell.eduCourse schedule: Nearly all assignments from articles will be excerpts. Of course, this is true of all assignments from books, as well. Since readings from Rawls' book, A Theory of Justice, will be directly from this required purchase, I have specified assignments from it in detail, below.
1. Introduction - courses.cit.cornell.edu
courses.cit.cornell.eduIslamic Finance in Multicultural Indonesia Thomas B. Pepinsky Assistant Professor of Government Cornell University pepinsky@cornell.edu . 1. Introduction . In this essay I consider the case for Islamic finance in multicultural Indonesia. I argue that as both a normative good and as a practical matter, the continued development of an Islamic ...

A Short Introduction to Epidemiology - Cornell University
courses.cit.cornell.eduA Short Introduction to Epidemiology . Second Edition . Neil Pearce. Occasional Report Series No 2 . Centre for Public Health Research . ... more material than is required for a short introductory course. This is a short introduction to epidemiology, and is not intended to be comprehensive.
Factors influencing bottled water drinking behavior
courses.cit.cornell.eduFactors influencing bottled water drinking behavior A survy on tors tt sp popl’s ls on ottl wtr n tp wtr ... used bottles can produce toxic byproducts. Therefore, it is necessary to investigate consumer’s behavior – why some people think bottled water is better than tap water and some think ... perception (Doria, Factors influencing ...

r rr rr rr (r ) P(r ) E( =ε + =ε r - courses.cit.cornell.edu
courses.cit.cornell.edu4 ECE 303 – Fall 2007 – Farhan Rana – Cornell University Wave Propagation in Uniaxial Media - I E(r ) o D(r) rr r ∇2 =−ω2 µ The starting point is the following wave equation:

Introduction to reinforcement learning
courses.cit.cornell.eduIntroduction to reinforcement learning Pantelis P. Analytis Introduction classical and operant conditioning Modeling human learning Ideas for semester projects The Iowa gambling task Participants are presented 4 decks on the computer and they are told that each deck will reward them or penalize

Chapter 3 Optical Transitions in Bulk Semiconductors
courses.cit.cornell.eduSemiconductor Optoelectronics (Farhan Rana, Cornell University) Chapter 3 Optical Transitions in Bulk Semiconductors 3.1 Introduction In this chapter we will discuss optical transitions in semiconductors, optical loss, and optical gain.

Handout 27 1D and 0D Nanostructures: Semiconductor …
courses.cit.cornell.edu1D and 0D Nanostructures: Semiconductor Quantum Wires and Quantum Dots In this lecture you will learn: • Semiconductor quantum wires and dots • Density of states in semiconductor quantum wires and dots Charles H. Henry (1937-) ECE 407 – Spring 2009 – Farhan Rana – Cornell University ... energy of the confined states:
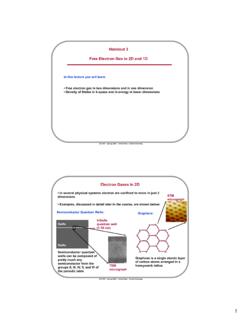
Handout 3 Free Electron Gas in 2D and 1D - Cornell University
courses.cit.cornell.eduHandout 3 Free Electron Gas in 2D and 1D ... • Density of States in k-space and in energy in lower dimensions ECE 407 – Spring 2009 – Farhan Rana – Cornell University Electron Gases in 2D • In several physical systems electron are confined to move in just 2 dimensions
Related documents
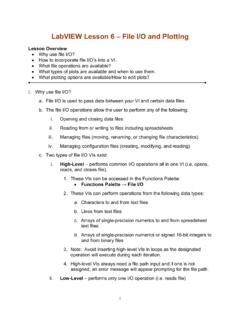
LabVIEW Lesson 6 – File I/O and Plotting
boson.physics.sc.eduLabVIEW Lesson 6 – File I/O and Plotting Lesson Overview • Why use file I/O? ... File I/O formats depend on the type of files being used. 3 types of formats exist: text, binary, and datalog. ... the plot lines, the type of data points (useful when plotting multiple sets of data), and many other options. ...

PLOTTING AND GRAPHICS OPTIONS IN MATHEMATICA
dslavsk.sites.luc.eduPLOTTING AND GRAPHICS OPTIONS IN MATHEMATICA In addition to being a powerful programming tool, Mathematica allows a wide array of plotting and graphing options. We will look at a variety of these, starting with the Plot command. ... Plot x, x^2, x^3, x ...
Math 141 - Quantile-Quantile Plots
people.reed.eduThe QQ plot The quantile–quantile plot, or QQplot, is a simple graphical method for comparing two sets of sample quantiles. Plot the pairs of order statistics (X (k);Y (k)): If the two datasets come from the same distribution, the points ... Math 141 - Quantile-Quantile Plots ...

Split Plots - Statistics
users.stat.umn.eduAll split plots in the same whole plot get the same level of the whole plot treatment factor. All levels of the split plot treatment factor occur in each whole plot. The restricted randomization is equivalent to the two randomizations of the unit structure approach.

Using SAS’s PROC GPLOT to plot data and lines
cob.jmu.eduUsing SAS’s PROC GPLOT to plot data and lines PROC GPLOT creates “publication quality” color graphics which can easily be exported into documents, presentations, etc. To export the graphs for future use click on file, export. In the dialog box choose a

Basic Plotting with Python and Matplotlib
courses.csail.mit.eduThe basic syntax for creating line plots is plt.plot(x,y), where x and y are arrays of the same length that specify the (x;y) pairs that form the line. For example, let’s plot the cosine function from 2 to 1.
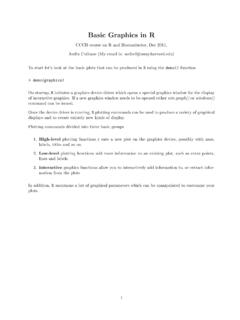
Basic Graphics in R - Harvard University
bcb.dfci.harvard.eduPlot of data.frame elements If the rst argument to plot() is a data.frame, this can be as simply as plot(x,y) providing 2 columns (variables in the data.frame). Lets look at the data in the data.frame airquality which measured the 6 air quality in New

Unit 9 Describing Relationships in Scatter Plots and Line ...
lycofs01.lycoming.edu56 Unit 9 Describing Relationships in Scatter Plots and Line Graphs Objectives: • To construct and interpret a scatter plot or line graph for two quantitative variables
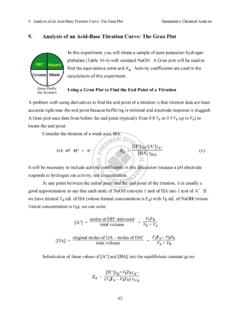
9. Analysis of an Acid-Base Titration Curve: The Gran Plot
web.mnstate.eduThe Gran plot in the acidic region gives accurate results even if there is CO2 dissolved in the strong base titrant. The Gran plot in the basic region can be used to measure CO2 in the strong base. For completeness, we note that if weak base, B, is titrated with a strong acid, the Gran

Plotting functions of more than one variable with Mathematica
physics.weber.eduPlotting functions of more than one variable with Mathematica Physics 3510, Weber State University This tutorial assumes that you are already somewhat familiar with Mathematica.
Related search queries
Lesson 6, File I/O, The Plot, PLOTTING AND GRAPHICS OPTIONS IN, Plot, Math 141 - Quantile-Quantile Plots, Split plots, Using SAS’s PROC GPLOT to plot data, Basic Plotting with Python and Matplotlib, Basic Graphics in R, Describing Relationships in Scatter Plots, Gran plot, Plotting functions of more than one variable with Mathematica