Transcription of LAB II. INTRODUCTION TO LABVIEW
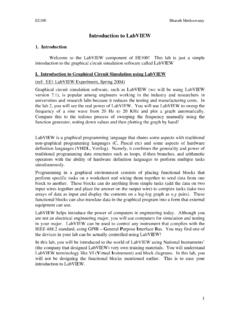
1 2-1 lab ii . INTRODUCTION TO LABVIEW 1. OBJECTIVE In this lab, you are to gain a basic understanding of how LABVIEW operates the lab equipment remotely. 2. OVERVIEW In the procedure of this lab, you will build a virtual instrument (VI) utilizing LABVIEW 2011. This will be accomplished in a flow chart programming environment where you will have to connect control blocks and virtual instruments (VIs) to build another virtual instrument. Specifically you will construct a virtual instrument that will configure the function generator output, program the oscilloscope to measure the output, and display the signal on the screen.
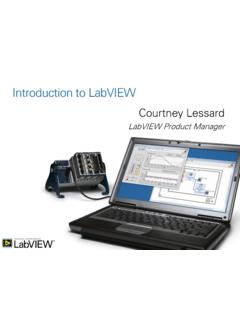
2 Information essential to your understanding of this lab: 1. LABVIEW 2011 Tutorial Materials necessary for this Experiment 1. Standard testing station 3. BACKGROUND INFORMATION LABVIEW is a programming environment that uses a graphical flow chart as the source code. LABVIEW allows us to control the instruments used in the EE 3110 labs. We can control all but one of the instruments in this lab using the bus. This includes the digital multi-meters, the oscilloscope, the function generator and source meters. In addition to controlling the instruments, LABVIEW allows us to get the information recorded into the computer where we can use a variety of math functions to alter it, fit it, analyze it using statistical functions, plot it on a graph, and store it to a file.
3 These capabilities allow us to focus on the devices being studied, not on the mechanics of taking the measurements. The beauty of LABVIEW is its intuitive graphical environment. Creating VI s is easy because you can think as if you are making an instrument. In the front panel programming window, you can envision all the controls that you want on the front panel of your instrument. As you place them on the front panel, they appear in the block diagram window. Now all you have to do is put in the logic circuits to execute the commands and wire together your controls and your logic functions. It has an extensive library of functions for controlling just about any GPIB (general purpose interface bus) instrument available.
4 This makes controlling and measuring data with the instruments as easy as plunking down a downloaded VI and providing it with the correct inputs and outputs. 4. PREPARATION Please review the online video for LABVIEW to gain some familiarity with this software before coming to class. 1. Go to the link INTRODUCTION to the LABVIEW Platform and watch a general INTRODUCTION to the LABVIEW software. 2-2 2. Record a few images from this presentation to a Word document by using Alt Prt Scr in order to verify that you have watched the appropriate video. 3. Print these images and submit them as your pre-lab work for lab ii . 5. PROCEDURE IN THIS LAB CLASS, DO NOT SAVE YOUR WORK TO THE C DRIVE.
5 Please use your USB key memory only. INTRODUCTION to the work environment To create any Virtual Instrument with LABVIEW , we need to work on two windows a block diagram window and a front panel window. The actual components (also called as internal functions) involved in the experiment are arranged in the block diagram window like in a flowchart. The various controls required to operate the components are inserted and arranged in the front panel window. The properties and the values of the various controls are updated in the front panel window. Finally, the controls are linked to the components in the block diagram window and wired suitably and then the design is debugged and then executed.
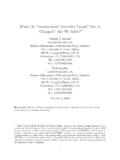
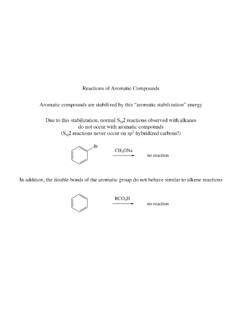
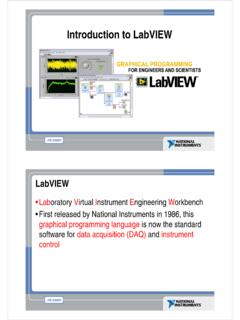
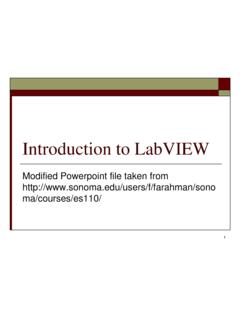
6 Example problem definition : Construct a VI that can set the function generator s output characteristics, including function (sine, square, triangle, or ramp waves, noise or dc) as well as its amplitude, frequency and offset voltage. Then use the oscilloscope to read the waveform into the computer and plot it in a graph. When you are finished, your front panel window and block diagram window may look something like Figure 1. Figure 1 is only given as an example. You can do the wiring and arrange the controls in any pattern you desire. a.) 2-3 b.) Figure 1. Possible screen shots of the block diagram window (a) and the front panel window (b).
7 ACQUIRING THE INTERNAL FUNCTIONS As you recall from the INTRODUCTION , the internal parts of your VI are always placed directly on the flow chart diagram. Make sure you are in the block diagram window. This is the LABVIEW window with the white background. If your functions pallet is not showing, select the Window menu from the main toolbar in the Diagram window and then select Show Functions Palette . This will make your functions palette appear. Your first task will be to search through the menus of the functions palette in order to, find and place the four instrument drivers needed to build your program. We would be using the oscilloscope and the function generator in this experiment and the various function palettes we would be using to operate these are given below.
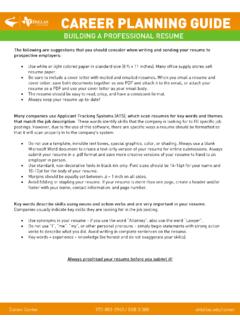
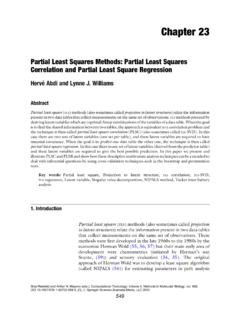
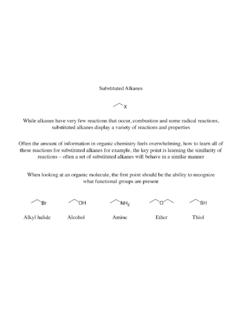
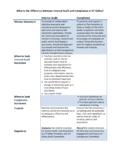
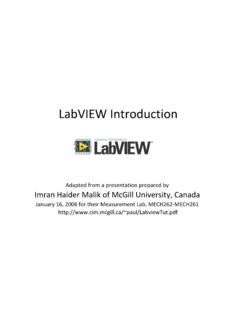
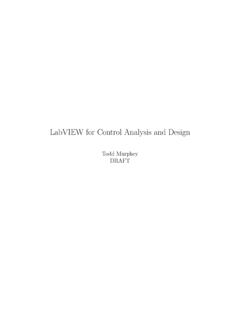
8 A.) b.) c.) d.) Figure 2. Functional blocks of the device drivers. Figure 2 a) is the hp 33120a - Select Arbitrary block or VI. This virtual instrument allows you to configure the function generator to output a certain wave such as a sine wave or a square wave. To find the hp 33120a - Select Arbitrary driver see Figure 3. "Instrument I/O >> Instrument Drivers" >> "HP33120A VIs" >> "Configure VIs" >> hp 33120a - Select Arbitrary Figure 3. An example of how to find the hp 33120a - Select Arbitrary after selecting the Instrument I/0 menu from the Functions Palette.
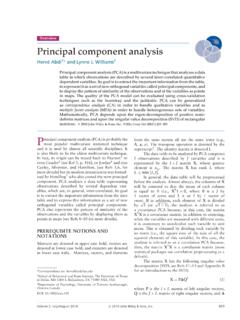
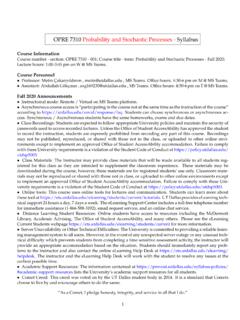
9 2-4 Figure 2 b) is the hp 33120a - Config " block. This function block configures all the parameters of the wave initiated by the hp 33120a - Select Arbitrary block. In other words, the hp 33120a - Config " VI allows you set the duty cycle, amplitude units, DC Offset, Peak Amplitude, and Frequency. It may be found under the Configure VIs menu along with the hp 33120a - Select Arbitrary block. Figure 2 c) is the "HP546 XXX " block. This block executes the auto scale function on the oscilloscope. To find the "HP546 XXX " driver see Figure 4. "Instrument I/O >> "Instrument Drivers" >> "HP546 XXX VIs" >> "Configure VIs" >> "HP546 XXX " Figure 4.
10 An example of how to find the "HP546 XXX " driver after selecting the Instrument I/0 menu from the Functions Palette . Figure 2 d) is the "HP54600A/610B Read " block. This block allows LABVIEW to read the wave on a selected channel of the oscilloscope. To find the "HP54600A/610B Read " block see Figure 5. "Instrument I/O >> "Instrument Drivers" >> "HP546 XXX VIs" >> "Data VIs" >> "HP54600A/610B Read " Figure 5. An example of how to find the "HP54600A/610B Read " driver after selecting the Instrument I/0 menu from the Functions Palette . Now that you are finished finding the drivers necessary for your virtual instrument, it is time to design your control panel in the Panel window.