Transcription of MT-053: Op Amp Distortion: HD, THD, THD + N, IMD, …
1 MT-053. TUTORIAL. op amp distortion : HD, THD, THD + N, IMD, SFDR, MTPR. HARMONIC distortion (HD) AND total HARMONIC distortion (THD). The dynamic range of an op amp may be defined in several ways. One of the most common ways is to specify harmonic distortion , total harmonic distortion (THD), or total harmonic distortion plus noise (THD + N). Other related specifications include intermodulation distortion (IMD), intercept points (IP2, IP3), spurious free dynamic range (SFDR), and multitone power ratio (MTPR). Harmonic distortion is simply the ratio of the rms value of the harmonic of interest (2nd, 3rd, etc.). to the rms signal level. In audio applications it is usually expressed as a percentage, but in communications applications it is more often expressed in dB. It is measured by applying a spectrally pure sinewave to an amplifier and observing the output of the amplifier with a spectrum analyzer.
2 total Harmonic distortion (THD) is the ratio of the root-sum-square value of all the harmonics (2 , 3 , 4 , etc.) to the rms signal level. Generally speaking, only the first five or six harmonics are significant in the THD measurement. In many practical situations, there is negligible error if only the second and third harmonics are included, since the higher order terms most often are greatly reduced in amplitude. total HARMONIC distortion PLUS NOISE (THD + N). total Harmonic distortion Plus Noise (THD + N) is the ratio of the root-sum-square of all the harmonics and noise components over a specified bandwidth to the rms signal level. It is important to note that the THD measurement does not include noise terms, while THD + N does. The noise term in the THD + N measurement must be integrated over the measurement bandwidth, and this bandwidth must be specified in order for the measurement to be meaningful.
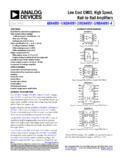
3 In narrow-band applications, the level of the noise may be reduced by filtering, in turn lowering the THD + N which increases the signal-to-noise ratio (SNR). Many times (especially in audio applications) when a THD specification is quoted, the manufacturer really means THD + N, since most measurement systems do not differentiate harmonically related signals from the other signals. The THD + N measurement is generally made by notching out the fundamental signal (to prevent overdrive) and measuring the residual signal which includes both noise and distortion components. Special analyzers made by Audio Precision are popular in audio applications for making THD + N measurements. The definitions of THD and THD + N are summarized in Figure 1. , 10/08, WK Page 1 of 8. MT-053. Vs = Signal Amplitude (RMS Volts). V2 = Second Harmonic Amplitude (RMS Volts). Vn = nth Harmonic Amplitude (RMS Volts).
4 Vnoise = RMS value of noise over measurement bandwidth V22 + V32 + V42 + .. + Vn2 + Vnoise2. THD + N =. Vs V22 + V32 + V42 + .. + Vn2. THD =. Vs Figure 1: THD and THD + N Definitions INTERMODULATION distortion (IMD). When a spectrally pure sinewave passes through an amplifier (or other active device), various harmonic distortion products are produced depending upon the nature and the severity of the non-linearity. However, simply measuring harmonic distortion produced by single tone sinewaves of various frequencies does not give all the information required to evaluate the amplifier's potential performance in a communications application. In most communications systems there are a number of channels which are "stacked" in frequency. It is often required that an amplifier be rated in terms of the intermodulation distortion (IMD) produced with two or more specified tones applied.
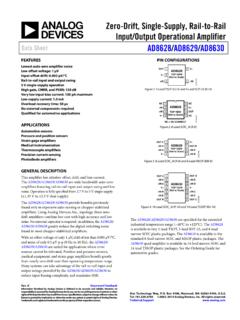
5 Intermodulation distortion products are of special interest in the IF and RF area, and a major concern in the design of radio receivers. Rather than simply examining the harmonic distortion or total harmonic distortion (THD) produced by a single tone sinewave input, it is often required to look at the distortion products produced by two tones. As shown in Figure 2, two tones will produce second and third order intermodulation products. The example shows the second and third order products produced by applying two frequencies, f1 and f2, to a nonlinear device. The second order products located at f2 + f1 and f2 f1 are located far away from the two tones, and may be removed by filtering. The third order products located at 2f1 + f2 and 2f2 + f1 may likewise be filtered. The third order products located at 2f1 f2 and 2f2. f1, however, are close to the original tones, and filtering them is difficult.
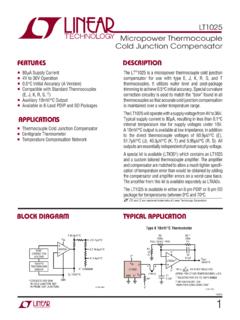
6 Third order IMD products are especially troublesome in multi-channel communications systems where the channel separation is constant across the frequency band. Third-order IMD products from large signals (blockers) can mask out smaller signals. Page 2 of 8. MT-053. 2 = SECOND ORDER IMD PRODUCTS. f1 f2 3 = THIRD ORDER IMD PRODUCTS. NOTE: f1 = 5 MHz, f2 = 6 MHz 2 2 3. f2 - f1 f2 + f 1 3f 1 2f2 + f1. 3 3 2f 1 2f 2 3. 2f1 - f2 2f2 - f1 2f1 + f2 3f 2. 1 4 5 6 7 10 11 12 15 16 17 18. FREQUENCY: MHz Figure 2: Second and Third Order Intermodulation distortion Products INTERCEPT POINTS AND 1 dB COMPRESSION POINT. Third order IMD is often specified in terms of the third order intercept point, as is shown by Figure 3, below. Two spectrally pure tones are applied to the system. The output signal power in a single tone (in dBm) as well as the relative amplitude of the third-order products (referenced to a single tone) is plotted as a function of input signal power.
7 The fundamental is shown by the slope = 1 curve in the diagram. If the system non-linearity is approximated by a power series expansion, it can be shown that second-order IMD amplitudes increase 2 dB for every 1 dB of signal increase, as represented by the slope = 2 curve in the diagram. SECOND ORDER. IP2 INTERCEPT. OUTPUT. POWER THIRD ORDER. (PER TONE) IP3 INTERCEPT. dBm 1dB. 1 dB COMPRESSION. POINT. FUNDAMENTAL. (SLOPE = 1). SECOND. ORDER IMD. (SLOPE = 2). THIRD ORDER IMD. (SLOPE = 3). INPUT POWER (PER TONE), dBm Figure 3: Intercept Points and 1 dB Compression Point Page 3 of 8. MT-053. Similarly, the third-order IMD amplitudes increase 3 dB for every 1 dB of signal increase, as indicated by the slope = 3 plotted line. With a low level two-tone input signal, and two data points, one can draw the second and third order IMD lines as they are shown in Figure 3 (using the principle that a point and a slope define a straight line).
8 Once the input reaches a certain level however, the output signal begins to soft-limit, or compress. A parameter of interest here is the 1 dB compression point. This is the point where the output signal is compressed 1dB from an ideal input/output transfer function. This is shown in Figure 3 within the region where the ideal slope = 1 line becomes dotted, and the actual response exhibits compression (solid). Nevertheless, both the second and third-order intercept lines may be extended, to intersect the (dotted) extension of the ideal output signal line. These intersections are called the second and third order intercept points, respectively, or IP2 and IP3. These power level values are usually referenced to the output power of the device delivered to a matched load (usually, but not necessarily 50 ) expressed in dBm. It should be noted that IP2, IP3, and the 1 dB compression point are all a function of frequency, and as one would expect, the distortion is worse at higher frequencies.
9 For a given frequency, knowing the third order intercept point allows calculation of the approximate level of the third-order IMD products as a function of output signal level. Figure 4. below shows the third order intercept value as a function of frequency for a typical wideband low- distortion amplifier. 50. 50. OUT. 50. 40. INTERCEPT (+dBm). IP3. 30. 20. 10. 1 10 100. FREQUENCY - MHz Figure 4: Third Order Intercept Point (IP3) versus Frequency for a Low distortion Amplifier Page 4 of 8. MT-053. Assume the op amp output signal is 5 MHz and 2 V peak-to-peak into a 100 load (50 . source and load termination). The voltage into the 50 load is therefore 1 V peak-to-peak, corresponding to +4 dBm. From Fig. 4, the value of the third order intercept at 5 MHz is 36. dBm. The difference between +36 dBm and +4 dBm is 32 dB. This value is then multiplied by 2. to yield 64 dB (the value of the third-order intermodulation products referenced to the power in a single tone).
10 Therefore, the intermodulation products should be 64 dBc (dB below carrier frequency), or at an output power level of 60 dBm. +36dBm @ 5 MHz, 3RD ORDER INTERCEPT. +30 IP3. +20. OUTPUT. POWER +10. dBm OUTPUT POWER = +4dBm 0. THIRD ORDER IMD. -10 (SLOPE = 3). OUTPUT. SLOPE = 1. -20. -30. -40. -50. -60 3RD ORDER IMD = -60dBm OR -64dBc -70. INPUT POWER (PER TONE), dBm Figure 5: Using IP3 to calculate the third-order IMD product amplitude Figure 5 shows the graphical analysis for this example. A similar analysis can be performed for the second-order intermodulation products, using data for IP2. SPURIOUS FREE DYNAMIC RANGE (SFDR). Another popular specification in communications systems is spurious free dynamic range, or SFDR. Figure 6 below shows two variations of this specification. Single-tone SFDR (left) is the ratio of the signal (or carrier) to the worst spur in the bandwidth of interest.