Transcription of RBC Select Balanced Portfolio
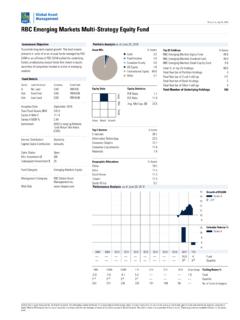
1 Printed on March 16, 2018 2018. Morningstar Research Inc. All Rights Reserved. The information contained herein: (1) is proprietary to Morningstar and/or its content providers; (2) may not be copied or distributed; and (3) is not warranted to be accurate, complete ortimely. Neither Morningstar nor its content providers are responsible for any damages or losses arising from any use of this information. Past performance is no guarantee of future results. These pages are not complete without the Select Balanced PortfolioInvestment ObjectiveTo provide long-term capital growth, with a secondaryfocus on modest income, by investing primarily in fundsmanaged by RBC GAM, investing in equity mutual fundsfor higher growth potential and fixed-income mutualfunds for diversification and the potential to generateincome. The Portfolio maintains a balance of investmentsacross several asset DetailsSeriesLoad StructureCurrencyFund CodeANo LoadCADRBF460 ANo LoadUSDRBF517 AdvDeferred SalesCADRBF841 AdvFront EndCADRBF741 AdvLow LoadCADRBF101 AdvLow LoadUSDRBF4517T5No LoadCADRBF546 Inception DateDecember 1986 Total fund Assets $Mil29, A NAV $ A MER % FTSE TMX CanadaUniverse Bond Index20% S&P 500 Total ReturnIndex (CAD)19% S&P/TSX CappedComposite Total ReturnIndex12% MSCI EAFE TotalReturn Net Index (CAD)4% MSCI EmergingMarkets Total Return NetIndex (CAD)Income DistributionQuarterlyCapital Gains DistributionAnnuallySales StatusOpenMin.
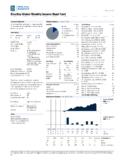
2 investment $500 Subsequent investment $25 fund CategoryGlobal Neutral BalancedManagement CompanyRBC Global AssetManagement Analysis is in CAD and for CAD series Afund (RBF460).This is a continuing fund resulting from a mergereffective June 27, Analysisas of February 28, 2018 Asset Mix% StyleValueBlendGrowthLargeMidSmallStatis ticsP/B Mkt Cap. $ 5 Sectors% Income Breakdown% Fixed IncomeGovernment Backed Investments (Cash & Other) Backed 10 Holdings% AssetsRBC Bond Global Corporate Bond European Equity US Multi-Style All-Cap Equity Canadian Dividend QUBE US Equity Private Canadian Equity Global Bond Emerging Markets Equity QUBE Canadian Equity % of Top 10 Number of Portfolio Holdings33 Total Number of Stock Holdings3,216 Total Number of Bond Holdings5,693 Total Number of Other Holdings271 Total Number of Underlying Holdings9,180 Performance Analysis as of February 28, 2018681012141618 Growth of $10,000 Series A$15, Returns %Series AFundQuartile1 Mth3 Mth6 Mth1 Yr3 Yr5 Yr10 YrSince Return % Quartile1402135513161257947639273 No.
3 Of Funds in CategoryPrinted on March 16, 2018 2018. Morningstar Research Inc. All Rights Reserved. The information contained herein: (1) is proprietary to Morningstar and/or its content providers; (2) may not be copied or distributed; and (3) is not warranted to be accurate, complete ortimely. Neither Morningstar nor its content providers are responsible for any damages or losses arising from any use of this information. Past performance is no guarantee of future results. These pages are not complete without the Select Balanced PortfolioManagement OverviewManager BiosSarah RiopelleRBC Global Asset Management Riopelle is Vice President and Senior PortfolioManager, investment Solutions. Sarah began herinvestment career in 1996. She is a member of both theRBC investment Strategy Committee and the RBCI nvestment Policy Committee, which are responsible forthe investment strategy and tactical asset allocation forRBC Funds Balanced products and Portfolio has a Bachelor of Commerce in Finance andInternational Management and is a CFA Analysis Cont'd as of February 28, 2018 Distributions ($)/UnitYTD*2017201620152014201320122011 201020092008 Total Distributions Gains Return Of Capital EndedEndedEndedEnded7-19974-19988-20001- 20052-20092-20095-20128-2010 Best/Worst Periods %1 Yr3 Yr5 Yr10 of Periods289265241181 Pct.
4 * Distributions are characterized into income type at Commentary as at December 31, 2017 The global economy is running at the fastest clip inseven years supported by an increasingly broad-based expansion, favourable financial conditionsand optimism among businesses and a result, we nudged our global growthforecasts higher for 2018 and expect firminginflation. Our forecasts for growth and inflation areslightly above fund s overweight position in equities andunderweight position in fixed income had apositive impact on performance. Bonds issued bynational governments posted modest returns in thefourth quarter of 2017 as inflation remainedsubdued and several major central banks extendedbond-buying programs designed to hold downlonger-term yields. Longer-maturity bondsoutperformed short-dated securities onexpectations that central banks will push upbenchmark interest rates. Returns were boosted byexposure to RBC Bond fund and RBC GlobalCorporate Bond equities gained in all major regions,benefiting from the synchronized expansion andrenewed profit growth.
5 Japanese stocksoutperformed on fiscal stimulus and pro-growthreforms, while the rallied on corporate-taxcuts. Europe and Canada gained too, butunderperformed given their lower exposure totechnology. Performance was aided byinvestments in Phillips, Hager & North Multi-Style All-Cap Equity fund , RBC QUBE EquityFund and RBC European Equity expect bond yields to move higher at a gradualpace, supported by the improving economy andmonetary tightening. Meanwhile, earnings havebeen coming through and analysts are optimisticthat the trend can persist. corporate-tax cutscould provide an additional boost to this backdrop, equities continue to offersuperior total-return potential compared to fixedincome and we have maintained our moderateoverweight in stocks and underweight in bonds asa on March 16, 2018 2018. Morningstar Research Inc. All Rights Reserved. The information contained herein: (1) is proprietary to Morningstar and/or its content providers; (2) may not be copied or distributed; and (3) is not warranted to be accurate, complete ortimely.
6 Neither Morningstar nor its content providers are responsible for any damages or losses arising from any use of this information. Past performance is no guarantee of future results. These pages are not complete without the Select Balanced PortfolioDisclosureRBC Funds, BlueBay Funds, PH&N Funds andRBC Corporate Class Funds are offered byRBC Global Asset Management Inc. anddistributed through authorized , trailing commissions,management fees and expenses all may beassociated with mutual fund read the prospectus or fund Factsdocument before investing. Except asotherwise noted, the indicated rates of returnare the historical annual compounded totalreturns including changes in unit value andreinvestment of all distributions and do nottake into account sales, redemption,distribution or optional charges or incometaxes payable by any unitholder that wouldhave reduced returns. Mutual funds are notguaranteed or covered by the CanadianDeposit Insurance Corporation or by any othergovernment deposit insurer.
7 For moneymarket funds, there can be no assurancesthat the fund will be able to maintain its netasset value per unit at a constant amount orthat the full amount of your investment in thefund will be returned to you. The value ofmutual funds change frequently and pastperformance may not be document has been compiled by RBCG lobal Asset Management Inc. (RBC GAM)from sources believed to be reliable, but norepresentations or warranty, express orimplied, are made by RBC GAM, its affiliatesor any other person as to its accuracy,completeness or correctness. All opinionsand estimates constitute RBC GAM'sjudgment as of the date of this document, aresubject to change without notice and areprovided in good faith but without legalresponsibility. The Top Ten/25 Holdings maychange due to ongoing Portfolio transactionswithin the fund . The Prospectus and otherinformation about the underlying investmentfunds are available at (%) for RBC Funds, PH&N Funds andBlueBay Funds is based on actual expensesfor the half-year period, January 1 to June30, 2017, expressed on an annualized (%) for RBC Corporate Class Funds isbased on actual expenses for the half-yearperiod, April 1, to September 30, 2017,expressed on an annualized H and Series I are not available forpurchase by new investors.
8 Existinginvestors who hold Series H or Series I unitscan continue to make additional investmentsinto the same series of the funds they are only used to illustrate the effectsof the compound growth rate and do notreflect future values of any fund or returns oninvestment of any fund profile is provided for informationalpurposes only. Particular investments and/ortrading strategies should be evaluatedrelative to each individual s investmentobjectives. The information contained in thefund profile is not, and should not beconstrued as, investment or tax advice. Youshould not act or rely on the informationcontained in the fund profile without seekingthe advice of an appropriate rankings are determined byMorningstar Research Inc., an independentresearch firm, based on categoriesmaintained by the Canadian InvestmentFunds Standards Committee (CIFSC). Quartilerankings are comparisons of the performanceof a fund to other funds in a particularcategory and are subject to change quartiles divide the data into four equalsegments expressed in terms of rank (1, 2, 3or 4).
9 This is the Morningstar quartile rankingof Series A and F units of the fund as ofFebruary 28, 2018. / Trademark(s) of Royal Bank of under licence. RBC Global AssetManagement Inc. 2018