Bode plots
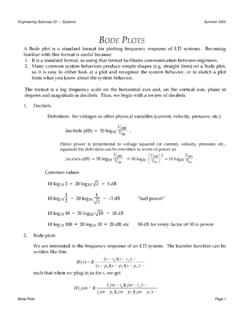
A Bode plot is a standard format for plotting frequency response of LTI systems. Becoming familiar with this format is useful because: 1. It is a standard format, so using that format facilitates communication between engineers. 2. Many common system behaviors produce simple shapes (e.g. straight lines) on a Bode plot,
Download Bode plots

Information
Domain:
Source:
Link to this page:
Documents from same domain
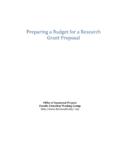
Preparing a Budget for a Research Grant Proposal
www.dartmouth.eduPreparing a Budget for a Research Grant Proposal Office of Sponsored Projects Faculty Education Working Group http://www.dartmouth.edu/~osp
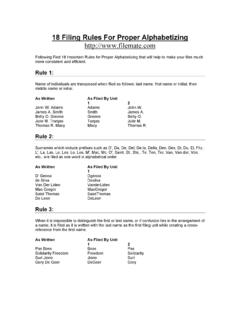
18 Filing Rules For Proper Alphabetizing …
www.dartmouth.eduB.Disregard conjunctions, articles and prepositions that are part of the name. As Written As Filed By Unit 1 2 3 Stop & Go Groceries Top of the World Bar
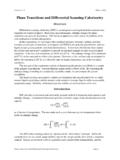
Phase Transitions and Differential Scanning …
www.dartmouth.eduChemistry 75 Winter, 2010 Phase Transitions and Differential Scanning Calorimetry Page 3 Melting Transitions In the first run, the melting of indium metal at 429 K will be observed and used as a
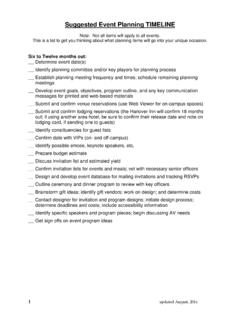
Suggested Event Planning TIMELINE - Dartmouth …
www.dartmouth.edu1 updated August, 2014 Suggested Event Planning TIMELINE Note: Not all items will apply to all events. This is a list to get you thinking about what planning items will go into your unique occasion.
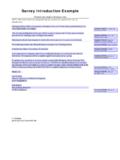
Example of a Survey Introduction - dartmouth.edu
www.dartmouth.eduG. Henning gavin.henning@dartmouth.edu Survey Introduction Example EXAMPLE OF A SURVEY INTRODUCTION NOTE: This would all be one paragraph, but the sections are separated for ease of
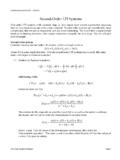
Second-Order LTI Systems
www.dartmouth.eduEngineering Sciences 22 — Systems 2nd Order Systems Handout Page 1 Second-Order LTI Systems First order LTI systems with constant, step, or zero inputs have simple exponential responses
Preparing a Budget for a Research Grant Proposal
www.dartmouth.eduPreparing a Budget for a Research Grant Proposal Office of Sponsored Projects Faculty Education Working Group http://www.dartmouth.edu/~osp
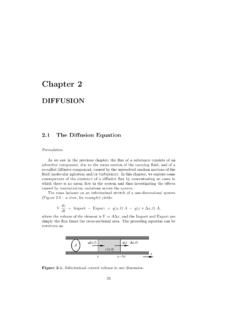
Chapter 2
www.dartmouth.eduChapter 2 DIFFUSION 2.1 The Diffusion Equation Formulation As we saw in the previous chapter, the flux of a substance consists of an advective component, due to the mean motion of the carrying fluid, and of a
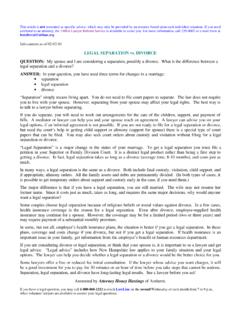
Info current as of 02-02-01 - dartmouth.edu
www.dartmouth.eduThis article is not presented as specific advice, which may only be provided by an attorney based upon each individual situation. If you need a referral to an attorney, the NHBA Lawyer Referral Service is available to assist you.
Suggested Event Planning TIMELINE - dartmouth.edu
www.dartmouth.edu2 updated August, 2014 3 to 6 months out: _ Initiate “Save the Date” mailing (if needed) _ Gather speaker biographies (if needed for printed program) _ Obtain final approval of invitation design and copy
Related documents
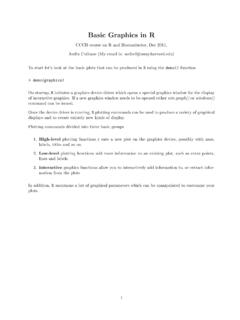
Basic Graphics in R - Harvard University
bcb.dfci.harvard.eduPlot of data.frame elements If the rst argument to plot() is a data.frame, this can be as simply as plot(x,y) providing 2 columns (variables in the data.frame). Lets look at the data in the data.frame airquality which measured the 6 air quality in New
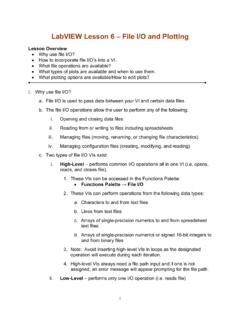
LabVIEW Lesson 6 – File I/O and Plotting
boson.physics.sc.eduLabVIEW Lesson 6 – File I/O and Plotting Lesson Overview • Why use file I/O? ... File I/O formats depend on the type of files being used. 3 types of formats exist: text, binary, and datalog. ... the plot lines, the type of data points (useful when plotting multiple sets of data), and many other options. ...

Using SAS’s PROC GPLOT to plot data and lines
cob.jmu.eduUsing SAS’s PROC GPLOT to plot data and lines PROC GPLOT creates “publication quality” color graphics which can easily be exported into documents, presentations, etc. To export the graphs for future use click on file, export. In the dialog box choose a

Basic Plotting with Python and Matplotlib
courses.csail.mit.eduThe basic syntax for creating line plots is plt.plot(x,y), where x and y are arrays of the same length that specify the (x;y) pairs that form the line. For example, let’s plot the cosine function from 2 to 1.

PLOTTING AND GRAPHICS OPTIONS IN MATHEMATICA
dslavsk.sites.luc.eduPLOTTING AND GRAPHICS OPTIONS IN MATHEMATICA In addition to being a powerful programming tool, Mathematica allows a wide array of plotting and graphing options. We will look at a variety of these, starting with the Plot command. ... Plot x, x^2, x^3, x ...

Unit 9 Describing Relationships in Scatter Plots and Line ...
lycofs01.lycoming.edu56 Unit 9 Describing Relationships in Scatter Plots and Line Graphs Objectives: • To construct and interpret a scatter plot or line graph for two quantitative variables
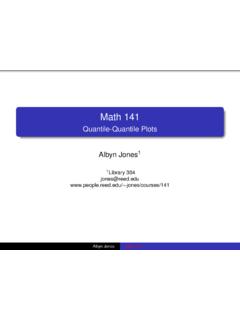
Math 141 - Quantile-Quantile Plots
people.reed.eduThe QQ plot The quantile–quantile plot, or QQplot, is a simple graphical method for comparing two sets of sample quantiles. Plot the pairs of order statistics (X (k);Y (k)): If the two datasets come from the same distribution, the points ... Math 141 - Quantile-Quantile Plots ...

Plotting functions of more than one variable with Mathematica
physics.weber.eduPlotting functions of more than one variable with Mathematica Physics 3510, Weber State University This tutorial assumes that you are already somewhat familiar with Mathematica.

Split Plots - Statistics
users.stat.umn.eduAll split plots in the same whole plot get the same level of the whole plot treatment factor. All levels of the split plot treatment factor occur in each whole plot. The restricted randomization is equivalent to the two randomizations of the unit structure approach.
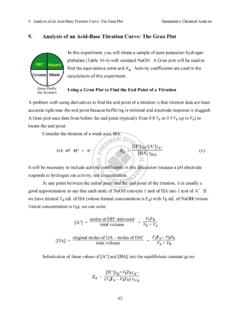
9. Analysis of an Acid-Base Titration Curve: The Gran Plot
web.mnstate.eduThe Gran plot in the acidic region gives accurate results even if there is CO2 dissolved in the strong base titrant. The Gran plot in the basic region can be used to measure CO2 in the strong base. For completeness, we note that if weak base, B, is titrated with a strong acid, the Gran
Related search queries
Basic Graphics in R, Plot, Lesson 6, File I/O, The Plot, Using SAS’s PROC GPLOT to plot data, Basic Plotting with Python and Matplotlib, PLOTTING AND GRAPHICS OPTIONS IN, Describing Relationships in Scatter Plots, Math 141 - Quantile-Quantile Plots, Plotting functions of more than one variable with Mathematica, Split plots, Gran plot