Transcription of Design and optimization of SYBR Green assays
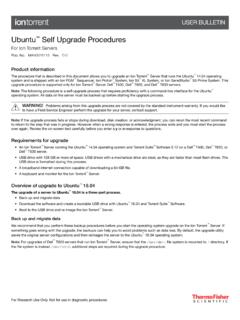
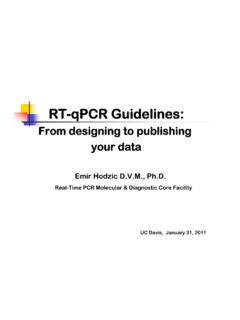
1 Design and optimization of sybr Green assaysThis guide is intended to help researchers Design and optimize scientifically sound qPCR experiments with Applied Biosystems sybr Green assays . These recommendations are consistent with the Minimum Information for Quantitative Experiment (MIQE) guidelines. By following the steps in this guide, you may be more confident that experimental results are based on the concentrations of target sequences, without limitations or biases introduced by enzymes, reagents, and, most notably, assay transcription (RT) beware of RT biasNearly all reverse transcriptases have the potential to introduce RT bias. If this happens, the amount of cDNA will not be consistently proportional to the amount How to test for RT biasWHITE PAPER sybr Green assaysFor qPCR measurement of relative gene expressionFigure 1. Experimental determination of RT bias. RT reactions were run on a dilution series of RNA. The resulting cDNA was used to construct qPCR standard curves.
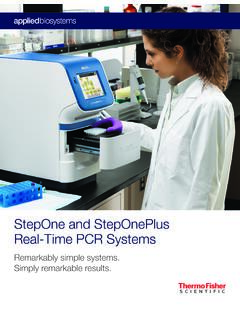
2 (A) The two qPCR standard curves are parallel for all concentrations, indicating no RT bias. (B) An example of RT bias is indicated by the oval. Constructing this RT-qPCR standard curve will reveal if you are introducing RT bias, and is an important check that should be done for each experimental assay. The standard curve will also indicate how much RNA you can use and maintain linearity for qPCR. If the purification scheme changes, the standard curve check should be quantityRNA ng RNAcDNAcDNAcDNAcDNA125 ng RNA 250 ng RNA 500 ng RNA Step 1: Reverse-transcribe 2-fold dilutions of a known amount of RNAStep 2: Run a qPCR standard curve (Figure 1) for each assay and an endogenous control 12of RNA in samples. When using relative quantitation methods, it is especially important to make sure that conclusions are based on the biological effects of your experimental treatments and not on limitations or bias of the reverse quantityRNA quantity6040200 RASCtCtGAPDHRASGAPDH6040200 sybr Green assays , step 1: bioinformatics1.
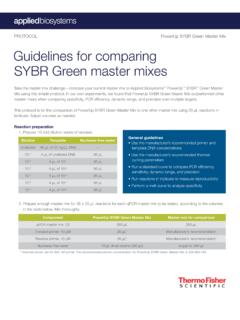
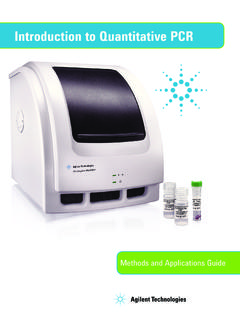
3 Obtain the sequence for the gene of interest, and select an exon-to-exon spanning region ~200 bp in Use a tool such as SNPmasker ( ) to mask for single-nucleotide polymorphisms (SNPs). SNPmasker will highlight any SNPs that nM500 nM800 nM100 nMReaction 1 Reaction 2 Reaction 3250 nMReaction 4 Reaction 5 Reaction 6500 nMReaction 7 Reaction 8 Reaction 9 Forward primer dF/dTTemperatureTemperature dF/dTGood result: single peak is indicative of a single PCR result: multiple peaks indicative of more than one PCR product. sybr Green dye will bind to both products and produce a primerShortcutSee page 3 for information on how to eliminate all bioinformatics sequence for RASatacaaggatgcgtacagtacattcagacgaatggcc gatagagc gcatatcgcgaacatcgcgcatatcgcgctaaagcgccta agcg ggcctaaaaggctcttccgcaaacatatacgcgcagtgcg cgcttac gaaggattggccattaggattagcccgccaggggattgag agc cagcccagcttagctcgatcgaacgactacaggctacata tataac gccgaattagccaggattatgccagggggtaattcagaca acaaaShortcutSee page 3 for information on how to eliminate all primer validation Green assays , step 2: primer validationIn primer validation, the objective is to find the right concentration of forward and reverse primers that will yield the lowest Ct and create no Run multiple qPCR reactions with 3 to 4 different concentrations of forward and reverse primers.
4 Actual quantities may vary from the example below. The appropriate range of primer concentrations is determined by the master Evaluate Ct for each Run a melting curve for each melting curve analysis shows primer-dimers, there are two options: Start over with the bioinformatics. Alter cycling temperatures to remove primer-dimers. However, this may result in assays that run with different cycling temperatures and so cannot be combined with other qPCR To avoid specificity issues, utilize a tool like RepeatMasker ( ) that will look for runs of Cs and Now take this qualified sequence and insert it into a primer Design tool such as Primer3web ( ). This should give you multiple sets of forward and reverse primers. Pick several for step Use the BLAST tool for primers ( ) to ensure that the primers chosen in step 4 are specific for your gene and unique to your species of interest. 6. Order your primers from total bioinformatics time: 1 2 hours Estimated reagent usage: 0 How to validate assay efficiency1.
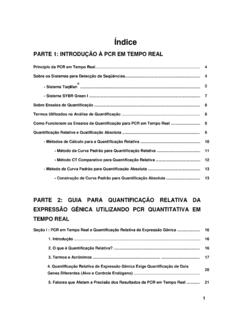
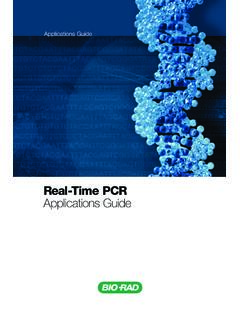
5 If necessary, reverse-transcribe RNA to Run a 5-point standard curve, in triplicate, using 10-fold dilutions for both the target gene and a reference Plot Ct vs. concentration to generate a standard curve for both target and reference genes (using qPCR software). Look for >90% efficiency (to use Ct). Slope values for the target gene and the reference gene should be within of each to all Design and optimization steps with TaqMan AssaysBioinformatics shortcut: Applied Biosystems Taq M a n assays minimize the need for more bioinformatics, because each assay has undergone our extensive 7-layer bioinformatics process before it arrives at your bench.* sybr Green assays , step 3: assay efficiencyThere are two primary methods of relative quantitation: relative standard curve, and comparative Ct ( Ct or ddCt). The efficiency of the assay (ability to double the amount of PCR product every cycle) will determine which method can be used. Relative standard curve Ct>90%<90%Assay e ciency Use when e ciency is <90% Takes away 30 sample wells from each plate Must have >90% e ciencyImportant The final calculation in Ct is 2 Ct.
6 The 2 implies perfect doubling of DNA with each cycle of the assay. If assay efficiency is <90%, it is not doubling with every cycle and the equations for Ct are no longer valid, requiring either a new start (with bioinformatics) or use of a relative standard curve. It is critical to determine assay efficiency if using validation shortcut: TaqMan assays help avoid the need for primer validation, because the combination of primers and probe is so highly specific that your qPCR instrument should detect only your target of efficiency shortcut: TaqMan assays are guaranteed to offer efficiencies of >90%.TaqMan assays are affordableFor less than you think, you can order a 75-reaction TaqMan Assay and start running experiments immediately. When you consider all the time, reagents, and samples** required to optimize a single sybr Green assay, TaqMan assays offer tremendous value. This is especially true if you find it necessary to start over at any point of the sybr Green assay Design and validation Assay guarantees: Sensitivity: 10 copies Assay efficiency: >90% Dynamic range: 7 logarithmic units (we have demonstrated 9) Ease of use: all TaqMan assays have the same cycling protocolsPowerTrack sybr Green Master MixApplied Biosystems Powe rTrac k SY B R Green Master Mix is formulated for maximum real-time PCR specificity and reproducibility, and includes a tracking dye system to minimize pipetting errors.
7 Built-in two-color tracking dye system to help improve pipetting accuracy and reaction setup Broad primer Tm and primer concentration compatibility allows qPCR reaction setup flexibility with minimal optimization Superior specificity and tight reproducibility in Ct values over a broad dynamic range improve data quality Compatible with Invitrogen SuperScript IV VILO Master Mix reverse transcription for fast, reproducible results Formulated with UNG and dUTP to prevent contamination of the reaction by carryover PCR products Broad instrument compatibilityFor more information about PowerTrack sybr Green Master Mix and additional sybr Green master mix formulations, go to * For exclusions, please see the TaqMan Guarantee Terms and Conditions at ** 39 qPCR reactions (9 or more for primer validation and 30 for assay efficiency)For Research Use Only. Not for use in diagnostic procedures. 2020 Thermo Fisher Scientific Inc. All rights reserved.
8 All trademarks are the property of Thermo Fisher Scientific and its subsidiaries unless otherwise specified. TaqMan is a registered trademark of Roche Molecular Systems, Inc., used under permission and license. BLAST is a trademark of the National Library of Medicine. COL23862 0220 Find out more about TaqMan assays at informationProductQuantityCat. sybr Green Master Mix, Mini Pack (1 mL)100 reactionsA46012 PowerTrack sybr Green Master Mix, 1-Pack (1 x 5 mL)500 reactionsA46109 PowerTrack sybr Green Master Mix, 2-Pack (2 x 5 mL)1,000 reactionsA 4 6110 PowerTrack sybr Green Master Mix, 5-Pack (5 x 5 mL)2,500 reactionsA 4 6111 PowerTrack sybr Green Master Mix, 10-Pack (10 x 5 mL)5,000 reactionsA 4 6112 PowerTrack sybr Green Master Mix, Bulk Pack (1 x 50 mL)5,000 reactionsA 4 6113