Transcription of Introduction to LabVIEW - Virginia Tech
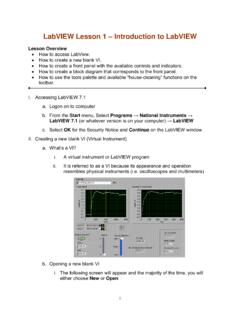
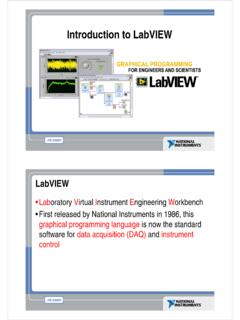
1 By Matt Downey National instrumentsIntroduction to LabVIEWC ourse Goals Become comfortable with the LabVIEW environment and data flow execution Ability to use LabVIEW to solve problems LabVIEW Concepts Acquiring, saving and loading data Find and use math and complex analysis functions Work with data types, such as arrays and clusters Displaying and printing resultsThe Virtual Instrumentation ApproachLabVIEW Graphical Development System Graphical Programming Environment Compile code for multiple OS and devices Useful in a broad range of applicationsVirtual Instrumentation Applications Design Signal and Image Processing Embedded System Programming (PC, DSP, FPGA, Microcontroller)
2 Simulation and Prototyping And Control Automatic Controls and Dynamic Systems Mechatronics and Robotics And Measurements Circuits and Electronics Measurements and Instrumentation And single graphical development platformThe NI Approach Integrated Hardware PlatformsHigh-SpeedDigitizersHigh-Resolu tionDigitizers and DMMsMultifunction Data AcquisitionDynamicSignal AcquisitionDigital I/OInstrumentControlCounter/TimersMachin eVisionMotion ControlDistributed I/O andEmbedded ControlLaptop PCPDAD esktop PCPXI Modular InstrumentationSignal Conditioningand SwitchingUnit Under TestSection I LabVIEW EnvironmentA.
3 Getting Data into your Computer Data Acquisition Devices NI-DAQ Simulated Data Acquisition Sound CardB. LabVIEW Environment Front Panel / Block Diagram Toolbar /Tools PaletteC. Components of a LabVIEW Application Creating a VI Data Flow ExecutionD. Additional Help Finding Functions Tips for Working in LabVIEWA. Setting Up Your Hardware Sound Card Built into most computersExercise 1 Setting Up Your Device Use Windows to: Verify your Sound CardUn-Mute MicrophoneStart All Programs National Instruments LabVIEW Screen:Start from a Blank VI:New Blank VIStart from an Example.
4 Examples Find orOpen and Run LabVIEWEach VI has2 WindowsFront Panel User Interface (UI) Controls = Inputs Indicators = OutputsBlock Diagram Graphical Code Data travels on wires from controls through functions to indicators Blocks execute by DataflowLabVIEW Programs Are Called Virtual Instruments (VIs)Controls Palette(Controls & Indicators)(Place items on the Front Panel Window)Indicator:Numeric SlideControl:NumericCustomize Palette ViewFunctions (and Structures) Palette(Place items on theBlock Diagram Window)Structure:While Loop Recommended: Automatic Selection Tool Tools to operate and modify both front panel and block diagram objectsOperating ToolPositioning/Resizing ToolLabeling ToolWiring ToolTools PaletteAutomatic Selection ToolAutomatically chooses among the following tools.
5 Run Button Continuous Run ButtonAbort ExecutionExecution Highlighting ButtonAdditional Buttons on the Diagram ToolbarStatus ToolbarRetain Wire Values ButtonStep Function ButtonsBlock Diagram WindowFront Panel WindowDemonstration 1: Creating a VIInputTerminalsOutputTerminalBooleanCon trolGraphIndicator Block diagram execution Dependent on the flow of data Block diagram does NOT execute left to right Node executes when data is available to ALL input terminals Nodes supply data to all output terminals when doneDataflow ProgrammingDebugging Techniques Finding Errors Execution Highlighting ProbesClick on broken showing error on Execution Highlightingbutton; data flow is animated using bubbles.
6 Values are displayed on on wire to display probe and it shows data as it flows through wire segment. You can also select Probe tool from Tools palette and click on 2 Acquiring a Signal with the Sound Card Use LabVIEW to: Acquire a signal from your sound cardThis exercise should take 15 Help Window Help Show Context Help, press the <Ctrl+H> keys Hover cursor over object to update windowAdditional Help Right-Click on the VI icon and choose Help, or Choose Detailed Help. on the context help windowTips for Working in LabVIEW Keystroke Shortcuts <Ctrl+H> Activate/Deactivate Context Help Window <Ctrl+B> Remove Broken Wires From Block Diagram <Ctrl+E> Toggle Between Front Panel and Block Diagram <Ctrl+Z> Undo (Also in Edit Menu) Tools Set Preferences in LabVIEW VI Properties Configure VI Appearance, Documentation, II Elements of Typical ProgramsA.
7 Loops While Loop For LoopB. Functions and SubVIs Types of Functions Creating Custom Functions (SubVI) Functions Palette & SearchingC. Decision Making and File IO Case Structure Select (simple If statement) File I/OLoops While Loops iterminal counts iteration Always runs at least once Runs until stop condition is met For Loops iterminal counts iterations Run according to input Nof count terminalWhile LoopFor LoopDrawing a Loop1. Select the structure2. Enclose code to be repeated3. Drop or drag additional nodes and then wire3 Types of Functions (from the Functions Palette)Express VIs: interactive VIs with configurable dialog page (blue border)Standard VIs: modularized VIs customized by wiring(customizable)Functions:fundamenta l operating elements of LabVIEW ; no front panel or block diagram (yellow)What Types of Functions are Available?
8 Input and Output Signal and Data Simulation Acquire and Generate Real Signals with DAQ Instrument I/O Assistant (Serial & GPIB) ActiveX for communication with other programs Analysis Signal Processing Statistics Advanced Math and Formulas Continuous Time Solver Storage File I/OExpress Functions PaletteSearching for Controls, VIs, and Functions Palettes are filled with hundreds of VIs Press the search button to index the all VIs for text searching Click and drag an item from the search window to the block diagram Double-click an item to open the owning paletteCreate SubVI Enclose area to be converted into a subVI.
9 Select Edit Create SubVIfrom the Edit Functions and SubVIs operate like Functions in other languagesFunction Pseudo Codefunction average (in1, in2, out){out = (in1 + in2) ;}SubVI Block DiagramCalling Program Pseudo Codemain{average (in1, in2, pointavg)}Calling VI Block DiagramExercise Acquire and Analysis Use LabVIEW Express VIs to: Acquire a signal and display its amplitude and frequencyThis exercise should take 15 Do I Make Decisions in LabVIEW ? (a)(b)(c)File I/OFile I/O passing data to and from files Files can be binary, text, or spreadsheet Write/Read LabVIEW Measurements file (*.)
10 Lvm)Writing to LVM fileReading from LVM fileFile I/O Programming Model Under the hoodOpen/Create/Replace FileRead and/orWrite to FileClose FileCheck forErrorsSection III Presenting your ResultsA. Displaying Data on the Front Panel Controls and Indicators Graphs and Charts Loop TimingB. Signal Processing MathScript Arrays Clusters WaveformsWhat Types of Controls and Indicators are Available? Numeric Data Number input and display Analog Sliders, Dials, and Gauges Boolean Data Buttons and LEDs Array & Matrix Data Numeric Display Chart Graph XY Graph Intensity Graph 3D graph.