Transcription of Introduction to Modern Data Acquisition with …
1 Introduction to Modern data Acquisition with labview and MATLABBy Matt Hollingsworth Introduction to Modern data Acquisition with labview and MATLABBy Matt Hollingsworth Table of ContentsIntroduction to Modern data 1 LabVIEWS ection : Introduction to 3 Section : A Simple labview 5 Section : Structures and Execution 10 Section : data and Execution 17 Section : Interactive labview 20 Section : SubVI 23 Section : Saving 27 Section : data 29 Section : Closing 31 MATLABS ection : Introduction to 33 Section : Simple Math with 35 Section : Matrices and 37 Section : 40 Section : Visualizing 42 Section : Importing 45 Section : Closing 46 LabSection : 48 Section : 49 Section : 50 Section : MATLAB and labview 52 Overv ewGoal: To learn to use the various computer tools available to acquire and analyze experimen-tal data . Materials: Computer with labview and MATLAB NI USB-6008 SummaSketchIII Conductive paper with electrodes Various cables BrainThis lab exercise is meant to give a sweeping overview of a couple of the tools available to a Modern experimental physicist.
2 The tools that this exercise will focus upon are labview and general, labview is a useful programming language when you need to produce some code that will acquire some data in a lab environment. You can quickly create code that will allow you to acquire some data , do some data analysis, display real-time results of that data , and export it in a format that will be capable of being read by other data analysis software (such as, in our case, MATLAB). MATLAB, on the other hand, is a handy mathematical toolbox that comes with many features that are useful for data analysis. It is also a widely accepted industry standard, so labview comes with built-in support for directly interfacing with the script server for MATLAB. This allows you to input commands from labview directly into the MATLAB kernel and have them executed as if you were typing them in the MATLAB command window. We will be exploiting this feature in order to generate some detailed visualization of the electric field between two electrodes.
3 This paper will not but scratch the surface of the functionality available to you through the labview and MATLAB platforms; however, my goal is to make you conversant enough to where you know what questions to ask/documentation to search for and you can understand the answers that you are given. The more acute functionality is left for you to discover yourself as you need , if you already know something that I am discussing in the labview and/or MAT-LAB sections, feel free to skip it and move on to something else. There are no exercises or any-thing in those two sections; the most important thing is that you are able to perform the final task presented to you in the actual case you are having trouble, each example has its corresponding .vi or .m file on my web site at To find the examples, look under Labs > Introduc-tion to Modern data you get stuck or have any questions, comments, complaints, or corrections, feel free to e-mail me at I d be more than happy to help, and I welcome your labview Sect on.
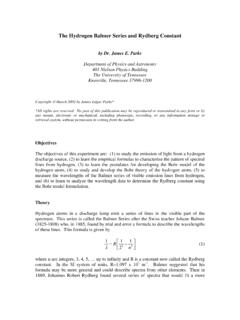
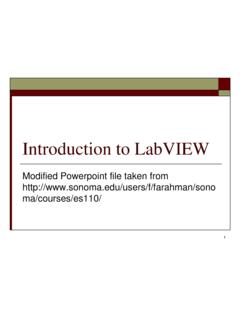
4 : Introduct on to LabVIEWS ection : Introduction to LabVIEWLabVIEW is a graphical programming language/IDE combination that is tailored for use in a lab environment. The basic analogy throughout labview is that of a virtual instrument or VI. In a labview program, just like a real instrument, you have controls (input), indicators (output), and logic to define the relationship between input and output. Here is a sample of a very basic labview program:Figure As you can probably already tell, this program takes two numbers, x and y, and outputs its sum. In labview , the lines that show data flow (in this case, they are thin orange lines, meaning they are single length, double accuracy numbers) are called wires. Inputs are called controls and outputs are called indicators. The plus sign inside the triangle is called a subVI, which is analogous to a subroutine or function in text-based languages. In this case, the sum subVI accepts two num-bers as arguments and outputs the sum.
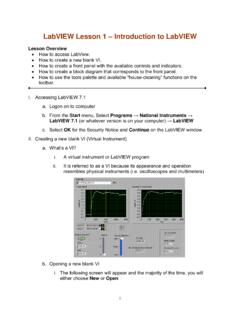
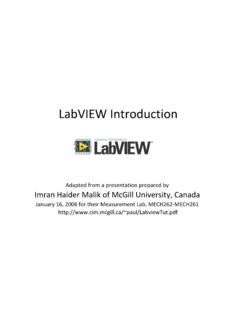
5 Sect on . : Introduct on to LabVIEWL ogic and interface are two separate entities in a labview program. The interface is called the front panel, while the programming logic itself is called the block diagram. Here is the front panel for the program pictured above:Figure order to run a program, you simply click the run arrow in the top left corner. To toggle looped execution, click the button with the revolving arrows (this causes the program to run con-tinuously). The main program execution buttons are detailed - Typical Execution Bar: Run Button: Run Continuously Button: Abort Button: Pause Button Sect on . : A S mple labview ProgramSection : A Simple labview ProgramTo begin writing a new labview program, simply start up labview , click new, and select blank VI when you are asked for a template. You now have a blank front panel and a blank block dia-gram. Navigate to the menu bar at the top of the screen, click window, and select Show Block Diagram (or press Ctrl + E).
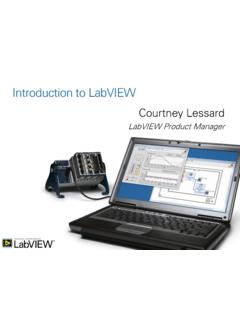
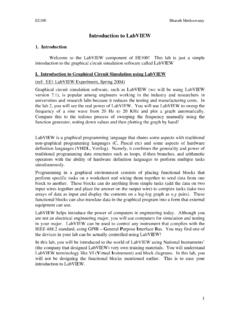
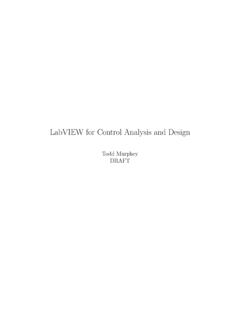
6 Right click anywhere in the white space of the block diagram to pop up the functions menu. Click All Functions in the bottom right of the popup window, and then click the thumbtack in the top right corner to keep the functions window open. Your screen should look something like this:Figure Click on the numeric box in the functions pallet (the on with the + and the 123 in it). Click and drag a sum subVI and a multiplication subVI onto the block diagram. Now we have some pro- Sect on . : A S mple labview Programgram logic, but we need something to input data . Navigate back to the front panel by select-ing Window > Show Front Panel from the menu bar at the top. Right click anywhere on the front panel, select the Num Ctrls box, and click and drag a Num Ctrl onto the front panel. Repeat so that there are two numeric controls on the front panel. Double click on the label of one of the controls ( Numeric by default) to change the name of the control to x.
7 Change the other to y . After all is said and done, your front panel/block diagram should look something like this: Figure Sect on . : A S mple labview ProgramNow, we will tell labview to output z, where z = (x+y)*x. To do this, we wire x and y to the sum subVI, wire the output of sum to one of the inputs of multiply, and then wire x to the other input of multiply, like so:Figure *Side Note* If you ever see wires appear as dotted lines with x s in various places on them, you wired something wrong. If this happens you may either right click the wire and tell it to delete the wire branch, left-click somewhere on the wire and finish wiring it properly, or hit Ctrl + B to remove all broken wires from the block all that is left is to create an indicator. You can return to the front panel and create a numeric indicator the same way that you created the numeric controls, but there is a quicker way. Right click on the output of the multiplication subVI (the right most tip of the triangle).
8 You ll see a menu pop up; select Create > Indicator. labview adds and automatically wires an indicator the output. For future reference, you may do the same thing when creating both indicators and con-stant terms. Here is the completed VI: Sect on . : A S mple labview ProgramFigure The program is now complete. Now, to test your new VI simply click the run button () to run your VI. Every time that you change x/y and run the VI, you should see an output, called out-put in our program, that corresponds to output = x*(x+y)If your program is not functioning properly, you may always click the little light bulb that is by the pause button in the menu bar of the block diagram. When this button is toggled, Highlight Execution Mode is turned on. This allows you to see your program execute step by step a very useful debugging feature. Furthermore, you may go to Window > Show Tools Palette, and place a probe on a wire by clicking the button and then clicking on a wire of which you would like to monitor the output.
9 Here is what a probed VI with execution highlighting turned on looks like. Sect on . : A S mple labview ProgramFigure is not necessary that every initial input be either the output of a control or the output of another subVI. If desired, you may also wire a constant to an input of a subVI. To add a numerical constant, go to the numerical palette and find the numerical constant object (the blue box with 123 in it). Put it on the block diagram. You can then right click on it and go to Representation to choose the data type (double precision, long integer, short integer, etc). You can then wire this constant to any numerical input of a subVI. There are other types of constants, such as array con-stants, enum constants, ring constants, etc., and they all work the same , if you ever get stuck, you should turn on the Context Help feature. To enable this feature, go to the help menu and click Show Context Help. As long as this mode is on, whenever you hover over a subVI a window will show you help information pertaining to the usage of that particular VI.
10 This is quite useful as a quick reference for times in which you know what a subVI does, but don t know exactly how to use it. 0 Sect on . : Structures and Execut on ControlJust as with any other programming language, labview comes complete with for loops and while loops. A for loop loops some code a set number of times, and a while loop loops until a certain condition is met. In labview , loops are represented by a box that surrounds the code that is being looped. For example, the following code counts from 1 to 10 on 1 second intervals:Figure Section : Structures and Execution Control Sect on . : Structures and Execut on ControlThe demonstrated loop is a for loop. N is the number of iterations you would like to do, and i is the zero based index of the current iteration. An equivalent way to formulate this algorithm, using a while loop instead, can be done like so:Figure a while loop, the stop sign is the termination condition. In this case, the stop condition is that the itera-tion index + 1 = 10, which is equivalent to a for loop with N = 10.