Transcription of Lab 2: Introduction to myDAQ and LabView - UTA
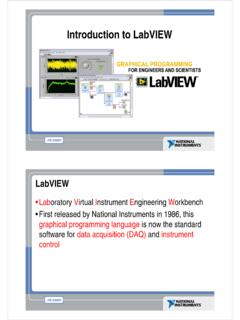
1 Lab 2: Introduction to myDAQ and LabView Lab Goals: Learn about LabView Programming Tools, Debugging and Handling Errors, Data Types and Structures, and Execution Structures. Learn about Arrays, Controls and Indicators Design a Temperature Convertor using the Case Structure, Enum, and While Loop data structures. Design a VI that calculates the area of a triangle using math operators Design a VI that displays a 1D and a 2D array and displays user defined elements from those arrays Due at the end of Lab: Copies of all 4 of the simple VIs you designed Definitions found at the end of the lab handout are due with the Lab Report Assignment 1: Build a VI to convert temperature 1. Go to and read the sections on Programming Tools, Debugging and Handling Errors, Data Types and Structures, ad Execution Structures. 2. Do the end of the module quiz for each of the above sections. 3. Design a VI that utilizes an Enum, Case Structure, and While Loop to do the following conversions: Celsius to Fahrenheit Fahrenheit to Celsius Celsius to Kelvin Fahrenheit to kelvin ** Note: Look up the appropriate temperature conversions (via Google, Bing, etc.)
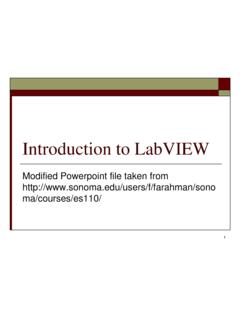
2 ** 4. Save the VI. Ex: 5. Call your TA over to verify the functionality of your VI Figure 1: Temperature Converter, Front panel Figure 2: Temperature Converter, Block diagram TA Signature: Assignment 2: Build a VI to find the area of a triangle 1. Read the following sections on Terminals, Controls, Indicators, and Constants 2. Build a VI that calculates the area of a triangle 3. Save the VI. Ex: 4. Call your TA over to verify the functionality of your VI Terminals Objects on the front panel window appear as terminals on the block diagram. Terminals are entry and exit ports that exchange information between the front panel and block diagram. Terminals are analogous to parameters and constants in text-based programming languages. Types of terminals include control or indicator terminals and node terminals. Control and indicator terminals belong to front panel controls and indicators. Data you enter into the front panel controls (a and b in the previous front panel) enter the block diagram through the control terminals.
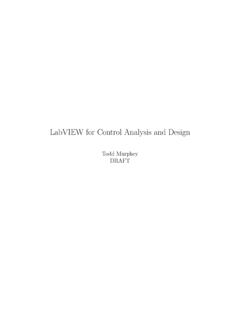
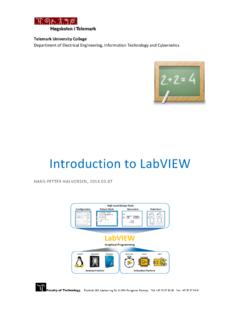
3 The data then enter the Add and Subtract functions. When the Add and Subtract functions complete their calculations, they produce new data values. The data values flow to the indicator terminals, where they update the front panel indicators (a+b and a b in the previous front panel). Controls, Indicators, and Constants Controls, indicators, and constants behave as inputs and outputs of the block diagram algorithm. Consider the implementation of the algorithm for the area of a triangle: Area = .5 * Base * Height In this algorithm, Base and Height are inputs and Area is an output, as shown in Figure 3. Figure 3. Area of a Triangle Front Panel The user will not change or access the constant .5, so it will not appear on the front panel unless included as documentation of the algorithm. Figure 4 shows a possible implementation of this algorithm on a LabView block diagram. This block diagram has four different terminals created by two controls, one constant, and one indicator.
4 1 Controls 2 Indicator 3 Constant Figure 4. Area of a Triangle Block Diagram with Icon Terminal View Notice that the Base (cm) and Height (cm) block diagram terminals have a different appearance from the Area (cm2) terminal. There are two distinguishing characteristics between a control and an indicator on the block diagram. The first is an arrow on the terminal that indicates the direction of data flow. The controls have arrows showing the data leaving the terminal, whereas the indicator has an arrow showing the data entering the terminal. The second distinguishing characteristic is the border around the terminal. Controls have a thick border and indicators have a thin border. You can view terminals with or without icon view. Figure 5 shows the same block diagram without using the icon view of the terminals; however, the same distinguishing characteristics between controls and indicators exist. Figure 5. Area of a Triangle Block Diagram without Icon Terminal View TA Signature: Assignment 3: Build a VI to display a 1D array of Prime Numbers 1.
5 Go to 2. Read sections regarding Creating Array Controls and Indicators, Creating Array Constants, And Array Inputs/ Outputs. 3. Create a 1D array with 5 elements 4. Populate the 1D array with incrementing Prime Numbers, starting at a value of your choosing. 5. Display the Array on your Front Panel. 6. Add an Index Array Function block to your 1D, 5-element array. 7. Create a Constant attached to the Index Array Function block. 8. Create an Indicator attached to your Index Array Function (displayed on your Front Panel now). 9. Display only the 3rd Element of your array and show the TA. 10. Save the VI. Ex: 11. Call your TA over to verify the functionality of your VI TA Signature: Assignment 4: Build a VI to display a 2D array of Prime Nnumbers 1. Repeat steps 1-9 of Assignment 4 for a 2D Array. This array will be a 5x5 array (5 rows and 5 columns). 2. Populate the 2D array with incrementing Prime Numbers, starting at a value of your choice.
6 3. Display the entire array on the Front Panel. 4. Separately, display only the 2nd row of the 2D array. 5. Separately, display only the 2nd column of the 2D array. 6. Separately, display only the (3, 4) element (3rd row, 4th column). 7. Save the VI. Ex: 8. Call your TA over to verify the functionality of your VI TA Signature: Lab Notes Date .. 2014 Important concepts / Key ideas Procedure / DATA Error Analysis / Thoughts Lab Report for Lab 2: The lab report for Lab 2 will be due at the beginning of the next lab period. Reports should be formatted in IEEE format. An example of this format can be found on the course website. Lab reports will not be accepted in any format outside of IEEE format. In addition to a report on the work completed during this lab period, please define, in an English sentence, the following terms in regards to variable types: -String -Floating point number -Integer -Double -Unsigned Integer -Array -Matrix -Cluster ( LabView specific) -Local vs.
7 Global variable Attach the definitions of these terms in an Appendix at the end of your report.