Transcription of Photoelectron spectroscopy for surface analysis: X-ray and ...
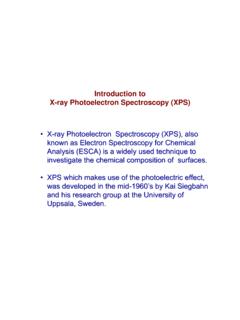
1 Photoelectron spectroscopy for surface analysis: X-ray and UV excitationLorenzo Calvo-Barrio and Gardenia Vargas Unitat d An lisi de Superf cies, CCiTUB, Universitat de Barcelona. Llu s Sol i Sabar s, 1-3, 08028 Barcelona, Spain. email: Abstract. This article summarizes the basic principles of Photoelectron spectroscopy for surface analysis, with examples of applications in material science that illustrate the capabilities of the related techniques. Handbook of instrumental techniques from CCiTUBP hotoelectron spectroscopy for surface analysis 1 1. 1. 1. 1. IntroductionIntroductionIntroductionIntr oduction Photoelectron spectroscopy (PES) is a general term used to describe the characterization techniques that study the surface of a material by using either X-rays or ultraviolet (UV) light as an excitation source to promote an electronic emission. In both cases, the physical effect upon which these techniques are based is the same, the photoelectric effect, which can be traced back to its first documented observation by Hertz in 1887.
2 During the first decades of the last century, the theory underlying this effect was quickly established together with the quantum theory, being Rutherford and Einstein [1] two of the well-known scientists who worked on its development. But it was not until the second half of the century that other researchers could develop some experimental devices that used the photoelectric effect to characterize the surface properties of materials. Those initial works culminated with a publication in 1967 by Kai Siegbahn [2], who explained how to obtain a spectrum by using X-rays as excitation source. At the same time, David W. Turner started to study free molecules in a gas phase by exciting them with ultraviolet light and collecting the emitted electrons. Since then, PES equipments have been built, their commercialization is in constant evolution and the technological parts, such as vacuum pumps, excitation sources, analyzers and electronics, are in continuous improvement.
3 Nowadays, hundreds of PES spectrometers are being used in cutting edge technology research centres. Instruments combining both X-ray and UV excitation are not uncommon since, besides the excitation source, the remaining parts of the equipment are practically identical. When X-ray excitation is used in PES, the technique is called XPS. It is also known as Electron spectroscopy for Chemical Analysis (ESCA), given the use made of the emitted electrons. In short terms, XPS involves the irradiation with soft monochromatic X-rays of a solid in vacuum, and the subsequent emission and study of the electrons produced by photoelectric effect. The collected electrons can be represented in a plot where the number of electrons versus their kinetic or binding energy is drawn. The information obtained concerns only the surface of the material, because the mean free path of electrons in solids is so small that the detected electrons originate from a few top atomic layers.
4 The achievement of quantitative measurements of the elemental composition and the identification of the different chemical states of the elements present at any surface are some of the main utilities of this technique. On the other hand, the technique is called UPS when UV excitation is used in PES. Principles are essentially the same as those of XPS, but such a low-energy radiation (below 50 eV) is only capable of ionizing electrons from the outermost levels of atoms, the valence band (VB). Since these levels are directly involved in molecular bonding features, this technique is also known as molecular Photoelectron spectroscopy . The study of the lower energy region of the spectra gives information about the density of occupied states (DOS) in the VB. Among other applications, this technique can be used to calculate the electronic band structure of a material and some relevant parameters concerning the interaction between interfaces.
5 2. 2. 2. 2. MethodologyMethodologyMethodologyMethodo logy Basic Principles Electrons are arranged in orbital levels around the nucleus and are bound to it by electrostatic attraction. Each orbital level has discrete energy levels that differ in value from the same orbital level in atoms of different elements, due to the different electrostatic attraction to the nuclei with different number of protons. The amount of energy required to remove one electron from the atom (the energy of its orbital level) is directly the binding energy of the electron. Therefore, a short wavelength photon from a specific X-ray source can be used to irradiate and thus to ionize an atom, producing an ejected free electron which characterizes the atom, as shown in Figure 1. Photoelectron spectroscopy for surface analysis 2 The kinetic energy of the emitted electron depends on the energy of the photon, which is given by Einstein s photoelectric law KE=hv BE, where BE is the binding energy of the atomic orbital from which the electron originates, hv is the energy of the incident X-ray (photon), and KE is the kinetic energy of the ejected electron ( Photoelectron ).
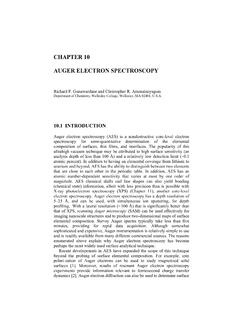
6 Just after this process (at about 10-14 s), the resultant excited ion relaxes by moving a second electron from an outer orbital level into the inner hole left by the photolectron. This transition produces a quantity of energy that the ion can use in two ways, either by releasing an X-ray or by emitting an electron. This third electron is called Auger electron, and its energy is given by KEauger=BE1 BE2 BE3, where BEi is the binding energy of the i-atomic orbital from which the Photoelectron originates, and KEauger is the kinetic energy of the last emitted electron. The main difference between the two emitted electrons is that the Photoelectron is dependent on the irradiation energy while the Auger electron is only dependent on the energy difference between the orbital levels, which is characteristic of each chemical element. It should be noticed that, when making realistic measurements, a new term, the work function of the spectrometer spec, has to be subtracted from the right hand side of these two equations.
7 This constant value is related to the fact that a small portion of energy is needed to capture the electron from the free electron level (or vacuum level) and bring it to the entrance of the analyzer to be counted. Furthermore, if the BE is referred to the Fermi level of the ion (EF, is the energy of the least tightly bound electrons within the solid) rather than to the free electron level, another small correction to the equations has to be done in order to account for the work function of the material . The photoelectric process occurs in the whole electronic structure from inner levels (also called core levels) to the less-bounded electrons of the VB. Moreover, the photoelectric process occurs all over the material that has been excited by the irradiation source, not only at the surface but typically some microns in depth. However, the surface sensitivity is an inherent characteristic of PES measurements due to the small inelastic electron mean free path ( ).
8 This parameter is dependent on the kinetic energy of the electron, and also on the substrate that has to cross. It varies from 1 to 10 nm for the majority of substrates and for kinetic energies below 2 keV. In addition, because of these low values, the path from the surface to the analyzer has to be controlled in order to avoid the loss of too many electrons due to scattering by air molecules. Therefore, ultra-high-vacuum chambers (UHV, less than 10-7 Pa) are highly recommended for acquiring reliable PES spectra. XPS spectra By collecting the emitted photoelectrons with an appropriate electron analyzer, counting them and studying the spectrum of the number of electrons versus its distribution of kinetic or binding energy Figure 1. Schematic plot of the photoelectric effect (left) and the subsequent Auger effect (right). LL22,,LL33 LL11 KK FFeerrmmii LLeevveell FFrreeee EElleeccttrroonn LLeevveell EEjjeecctteedd AAuuggeerr eelleeccttrroonn 11ss 22ss 22pp Conduction Band Valence Band Conduction Band Valence Band LL22,,LL33 LL11 KK FFeerrmmii LLeevveell FFrreeee EElleeccttrroonn LLeevveell IInncciiddeenntt XX--rraayy PPhhoottooeelleeccttrroonn 11ss 22ss 22pp Photoelectron spectroscopy for surface analysis 3 (using the former equation), it is possible to recognize the material they come from.
9 The analysis of a wide range of BEs will provide unique signatures of the elements as a function of their atomic number, thus providing elemental analysis. Moreover, if a mixture of elements is present, BE information will be related to all the elements and to their concentration ratio (the spectrum of a mixture of elements is approximately the sum of the spectra of the individual components). In this case a new problem arises: to determine the element from which a specific electron belongs, because overlapping of orbital levels from different elements could appear. This difficulty can be solved by looking for all the other orbital levels to know if the element is present or not. The main features of a XPS spectrum of elemental uranium excited by a eV AlK monochromatic X-ray line are shown in Figure 2. First of all, primary peaks resulting from the Photoelectron process (a) can be seen.
10 Some of them are in groups of two peaks as a consequence of the spin-orbit splitting (degeneration) that takes place in all orbital levels except in the s one. The intensity ratio between the two peaks depends only on the angular momentum 1 of the orbital level, but the distance between them depends also on the atomic number Z. The width of every primary peak depends quadratically on three contributions, one related to the physical nature of the atoms, another one concerning the analyzer characteristics, and a final one produced by the excitation source. The physical contribution cannot be modified because it originates from Heisenberg s uncertainty principle [3], but the two others can be reduced by improving the technique methodology. Figure 2. XPS spectrum of elemental uranium. The characteristic background (b) of the XPS spectrum is mainly due to the inelastically scattered electrons.