Transcription of INTRODUCTION TO LABVIEW - Michigan …
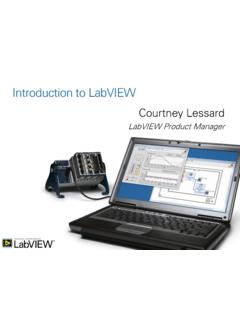
1 INTRODUCTION TO LABVIEWIn this lab we are going to understand the fundamentals of LABVIEW . We further go on toperform certain experiments using LABVIEW simulations. The Agilent scopes are alsoused to prove that the simulations are just as accurate as performing the experiment usingactual is short for Laboratory Virtual Instrument Engineering Workbench, is aprogramming environment in which you create programs with graphics; in this regard itdiffers from traditional programming languages like C, Pascal in which you program withtext. However LABVIEW is much more than a language. It is a program developmentand execution system designed for people , like you engineers, who need to program asparts their very powerful G language programming, LABVIEW can speed up programmingconsiderably as it is specifically designed to take measurements, analyze data, andpresent results to the user. it is more versatile than bench top instruments as you , not theinstrument manufacturer define instrument of LABVIEW s graphical nature, it is inherently a data presentation appears in any form you desire.
2 Charts, graphs, and user-defined graphicscomprise just a fraction of available output programs are called virtual instruments (VI s) because their appearance andoperation imitate actual instruments. Behind the scenes they are analogous to mainprograms, functions and subroutines from popular programming languages like C VI has three main parts: The front panel: this is the interactive user interface of the VI, so named becauseit simulates the front panel of a physical instrument. It can contain knobs, pushbuttons, graphs and other controls that can be inputted by the user. The block diagram is the VI s source code constructed in the programminglanguage G. This is the actual executable program. The components are lowerlevel VI s. built in functions, constants and program execution control panel objects have corresponding terminals on the block diagram so datacan pass from the user to the program and back to the user. In order to use the VI as a subroutine in a block diagram of another VI, it musthave an icon and a connector.
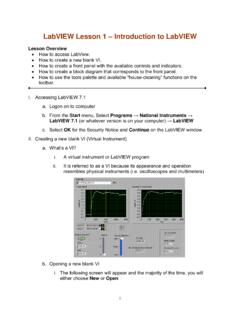
3 A VI used within another VI is called a subVI andis analogous to a was some of the INTRODUCTION to LABVIEW . Now it is time we perform someexperiments to actually get acquainted with the software. Open the National Instruments LABVIEW from the desktop. Close the VI windows that opens along with the wizard. On the main LABVIEW window click on DAQ solutions. Click on view current channel configuration. Ideally it should not have anychannels defined. Close that window and click on DAQ channel wizard. Right click on data neighborhood and select create new. Create a new virtual select analog input and follow the self-explanatory instructions to create a channelthat has an input range of plus/minus 5V. Select channel 0 first to be the designated inputchannel. Thus you have to create a channel that measures voltage. Give commentswherever there are spaces given and write in brief about the type of channel and the rangeit has.
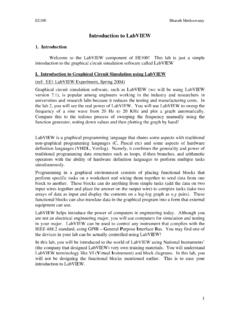
4 Select the single ended referenced input when configuring the the window and then click on view current channel configuration again. This timeyou should see the channel that you just created. Now click on next and select solutions gallery before clicking next. Select bench-top instruments and select the 1 channel the channel you have described and then click open to view the 1 new VI should open up where we see a graph and some other buttons. This is thevirtual oscilloscope. To see the block diagram, go to window and click on show is the connections diagram and the corresponding G code for the oscilloscope wejust need to give an input to this oscilloscope. This is done through an external hardwarefunction generator. We use the Agilent 33250A for this experiment. Set up the functiongenerator so that it produces a 1kHz sine wave with a peak-to-peak amplitude of sure that the function generator is in the high Z connect the T BNC connector so that the main connector is connected to thefunction generator and there are two more BNC connectors available to connect twoother external signal is fed to the computer using the National Instruments board.
5 Onewires from the function generator is connected to the input channel that was designatedfor input from the oscilloscope while the other wire is connected to the ref connection,which is the bottom most single connection on the same board. This is the groundconnection for the board. If we do not connect this we have a floating ground is overcome using the ground reference. Now we can see the signal on the have successfully been able to configure LABVIEW to accept signals from an THE A/D CONVERTER IN THE the further experiments, take plots for what ever you feel will be better explainedwith the use of the the same frequency we used for the simulations using LABVIEW , we put thatsignal in the Agilent 54621D oscilloscope. Select the math function and the FFT to obtain the spectrum of the sine wave. Change the time axes to change the number of samples/sec, making it 20kSa/sec. Choosing the more FFT function, change the scale to 10dB.
6 Now select the acquire function and select the averaging function. Let thenumber of averages be now have the frequency to 1kHz. Observe the spectrum and explain the peaksobtained at the 1,3,5 increase the frequency in steps of to Observe the change in thespectrum and explain the new spectrum. Turn the scope to normal instead of averagingsignal and then see the spectrum. We see that the peak we saw that was created withaveraging was actually just a shift in the peak. But since the scope is in averaging, wesee two above two parts of the experiment will enable us to perform the other experimentsdescribed this we need to open a virtual spectrum analyzer. Using the same steps describedabove we open a spectrum analyzer instead of a 1-channel oscilloscope. The steps aredescribed below for convenience. From the LABVIEW wizard select solutions gallery. There select bench top instruments and spectrum analyzer. Select the channel that you have configured and then click open.
7 This opens the virtual spectrum the virtual spectrum analyzer we see that the instrument front panel is divided intotwo sections. The upper half that represents the input signal in time scale and the bottomthat represents the signal on a frequency axes as a spectrum input is a 1kHz sine wave. From the controls in the front panel of the spectrumanalyzer we select the sampling rate to be 22050 and the frame size to be 1024. Theseare important parameters that help us view aliasing the spectrum analyzer we see a peak at 1kHz. This corresponds to the sine frequency of the display can be defined as fs-fin, where fs is the sampling frequencyand fin is the input frequency. Sampling frequency is approximately 22kHz. Thus as wechange the value of input frequency, the display frequency also the input frequency in steps of 1kHz. We see that the peak shifts by 1 kHz everytime we increase the frequency. After 11kHz, the peak shifts in the opposite time we increase the frequency by 1 kHz, the peak shifts to the left now.
8 Explainthis DISTORTIONFor this part of the experiment we keep the frequency of the sine wave at a constant100Hz instead change the amplitude of the signal. This frequency was chosen so that wecan actually see the sine wave clearly on the spectrum increase the amplitude of the sine wave and observe the time scale graph on thevirtual spectrum analyzer till we see clipping occur. At the exact point where clippingoccurs observe the spectrum in the frequency spectrum. We see that a lot more peaksappear where clipping begins to occur. This means that the quantization noise is greaterthan Q2/12, which is the theoretical noise between 0 fs/2. Explain the reason for switch back to the Agilent 54621D oscilloscope and view the FFT of the the necessary changes so that we can view the spectrum we reduce the amplitude. Reduce the amplitude from 1Vp-p, to 100mV. Now seethe averaged spectrum. Recall that we can obtain averaging by selecting the acquireoption on the oscilloscope and then selecting averaging from the on screen menu.
9 Howmany dB has the peak gone down by? Now reduce the amplitude further till we loose thesignal in the noise (without averaging). What is this amplitude?TONESFor the first part of this experiment we use the virtual spectrum analyzer from in the spectrum analyzer, change the sampling rate to 10012 and the window size to1027. Sine wave has a frequency of 1kHz and the amplitude is 1Vp-p. Explain thespectrum that you switch to the Agilent 54621D oscilloscope. View the same signal as a FFT on theoscilloscope first without the averaging function and then with the averaging function the circuit by 100Hz and again observe the circuit. Observe the spectrum withand without averaging. Explain the t forget to clean up before you leave your table!!