Transcription of Re-Introduction to LabVIEW
1 EE 3305 LabVIEW Tutorial introduction to LabVIEW The program LabVIEW uses the technique of graphical programming. This type of coding is referred to as G-Code (for graphical code). The program developed by National Instruments is widely used in industry for a variety of applications. One of these important applications is the automation of information gathering. Since many experiments are done under controlled conditions, changing these controlling conditions becomes a big part of the experiment. When using LabVIEW many settings of the instruments can be changed remotely instead of manually. This also comes in handy when a variety of measurements are needed over a large range of values. For instance, later this term you will be asked to use LabVIEW to make voltage measurements for a circuit. There are about 4 measurements per input voltage change, and over a few input voltage changes these measurements add up to a large amount of measurements (and time).
2 What if there was a way to set up a computer program to change and measure all of the different measurements? What happens is that experiments become more efficient and take less time. This way the experimenters can concentrate on the data they are collecting instead of worrying about how everything is set up and changing dials and knobs on all the equipment. In this lab, the basics of LabVIEW programming will be discussed, and it will be left to the student(s) to learn how to manipulate the programming to fit the needs of the experiment. The first thing to learn about LabVIEW programming is the type of interface that the devices are connected. In the lab the devices use what is called GPIB, or General Purpose Interface Bus, and has become the IEEE standard. There is also an RS-232 connection (serial port) but that is not of use for the equipment that is at hand.
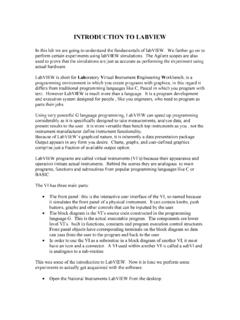
3 The GPIB connections are much like a SCSI connection on computer equipment. This is due to the daisy chain connection capability that the devices have. Looking at the back of the devices on the lab table there are tags that say IEEE 488 or GPIB Connector on them. These cables go back down to the system controller located inside the computer. This is the device that the computer uses to talk to the individual pieces of equipment. The way to determine exactly which device that needs to be addressed is taken care of in the programming. By changing the GPIB address in the program any and all devices connected to the bus can be used or manipulated in LabVIEW . Window introduction First, the two main panels of LabVIEW should be familiar. The first is the Front Panel and this is where all the controls and indicators are located.
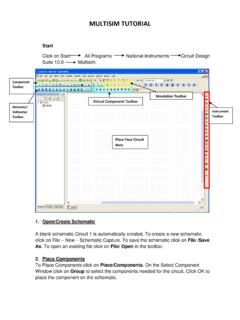
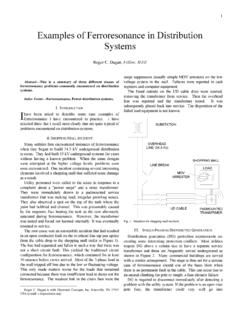
4 The second window, where all the coding and wire connections take place is called the Diagram. The Diagram is where most of the important connections of LabVIEW are made, and the guts of the programs. Any information that is needed during the simulation can be found in the controls and indicators on the Front Panel. So, get to know these windows, because they are the most important ones in the EE 3305 LabVIEW Tutorial program. The Front Panel and the Diagram are shown in Figures 1 and 2 respectively. Figure 1: Front Panel Diagram in LabVIEW Figure 2: Diagram Window in LabVIEW There are two other windows that should be of concern right now too. These are the Controls Palette and the Function Palette. Each of these palettes is used in one window or the other. The Controls Palette is used on the Front Panel for placing objects such as indicators, controls and different types of graphs and charts.
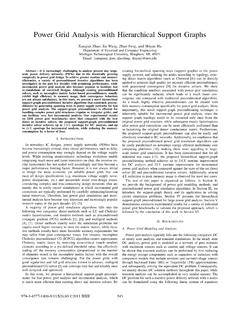
5 The Function Palette is used in the diagram window for placing Boolean operators, mathematical operations, and many other different VI s, or Virtual Instruments. The Controls Palette and Function Palette are shown in Figures 3 and 4 respectively. EE 3305 LabVIEW Tutorial Figure 3: The Controls Palette of the Front Panel in LabVIEW Figure 4: The Function Palette of the Diagram Window in LabVIEW Get to know these windows too. Notice that as the mouse is moved over each of the different blocks of the windows, text at the top of the window shows what the block contains. This is how the location of certain items will be addressed. Also notice then when you get into a submenu of the main menus, the blue arrow on the top left of the window becomes active. This is to show that the menu goes up, and returns to a higher level. Try this out for yourself and see how it works.
6 EE 3305 LabVIEW Tutorial The final window that needs to be discussed is the Tools Palette. The Tools Palette contains all the tools that will be needed for changing data, changing switches, moving items around, and connecting parts on the Diagram. The Tools Palette is shown in Figure 5. Notice you can mouse over on these tools and a help bubble will appear to tell what the device is or does. Now to demonstrate how LabVIEW works with a step-by-step of how to control the Agilent E3649A Dual Power Supply. Figure 5: The Tools Palette in LabVIEW is common to the Front Panel and the Diagram Step-by-Step Note: All of the commands that are acceptable for the E3649A Dual Power Supply are located in the manuals in the file cabinet in the back of the room. Most of the commands that will be needed are located in Section 4, Pages 111-120.
7 1. First, switch to the diagram window, and draw a Sequence Box (Functions Structures Sequence Structure) that covers most of the diagram window. 2. Right Click on the Sequence Box and select Add Frame Before . Notice that is places a Frame Indicator at the top of the Sequence Box, and it should indicate 0 (frame zero). A Sequence Box performs all instructions contained in a frame before moving on to the next frame. This is analogous to top down programming design in a higher level language. 3. If the frame displayed is not Frame 0, change it to Frame 0. Now place a GPIB Initialization box (Functions Instrument I/O GPIB GPIB Initialization). This will give you the initialization process that is required to make LabVIEW aware of where the controller is located. 4. Select the Wire Connection tool from the Tools Palette and mouse over on the GPIB Initialization box until you find Address String.
8 When you find that, right click and choose Create Constant . When the box comes up, type in 0 (zero). Have your TA initial your sheet. TA INITIAL _____ EE 3305 LabVIEW Tutorial 5. Now change to Frame 1 and place a GPIB Write Box (Functions Instrument I/O GPIB GPIB Write). The Write Box allows the computer to write to the instrument specified. At this point you can turn on the Agilent E3649A Dual Power Supply. Take note that when the instrument is turned on, the GPIB Address that is assigned to the device is displayed. Record the GPIB Address of the device _____. 6. Using the Wire Connect tool from the Tools Palette mouse over until you find the Address String . When you do, right click and choose Create Constant once again. In the box type the address of the E3649A Dual Power Supply found in Step 5.
9 You can also check out the other input and output terminals on the device to see what they are. Any information that appears in parenthesis after the name of the terminal is the default setting. Most of these defaults will work for the purposes of these experiments. 7. Now, still using the Wire Connect tool from the Tools Palette right click on the data input terminal of the GPIB Write box and choose Create Control . This will put a block in the Diagram that says data and also a new control on the Front Panel that says data . The data block on the Front Panel is where the commands will be sent to the power supply. Note: The next step is optional and is not required, but could help in finding errors that occur in the communication with the device. 8. Now to try and help with errors we need to add an Unbundle box (Functions Cluster Unbundle).
10 This takes the error information out of the GPIB Write, if any exists and places it into separate categories. Use the Wire Connect tool and connect the error out to the Unbundle box. Notice what happened to the Unbundle box. Right click on all of the new boxes that appeared and Create Indicator . All the new indicators will be shown on the Diagram and the Front Panel. 9. Return to the Front Panel and click the Run Continuously button (Two arrows chasing each other on the top of the window). This will obviously cause the simulation to run until it is stopped by the user. In the box labeled data type the following command into the box, VOLT , and click anywhere else on the Front Panel. If everything is correct the power supply will now be changed to V with a really large current. If this happens, have your TA Initial your sheet.