Transcription of Plotting Data with Microsoft Excel - Rice University
1 Plotting with Microsoft Excel1 Plotting data with Microsoft ExcelHere is an example of an attempt to plot parametric data in a scientifically meaningfulway, using Microsoft Excel . This example describes an experience using the Office Xversion for Macintosh. The details may change with different versions, but the principlestays the same the author must control the appearance of all aspects of the figure. Wecannot count on programmers to have correctly guessed our intended use of you find that it is just too awkward to prepare a proper figure using a computerprogram, then do it by hand. If you use a hand drawn graph do keep in mind its it is to be a working document, not to be presented or published, then you may want tomake it as large as you can, ignoring margins, for maximum accuracy. For a paper orpresentation, just keep the figure well within the margins of your sheet of graph paper,since the purpose is to illustrate the result, not to use the graph as a working don't need to fill up all available space.
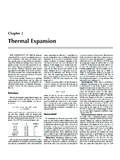
2 If you submit a manuscript for publicationor conduct a formal presentation, then you will probably have to prepare a computergenerated DEFAULTT able 1 represents measurements of heights of tree seedlings as they were allowed togrow. If you haven't much experience Plotting with Excel you might want to open a newspreadsheet, enter the data , and follow along with the example. The data were enteredinto an Excel spreadsheet in columns in the same order as they appear in the table, withtime (the independent variable) listed in the first 1. Time course of growth of seedlings of three commonNorth American tree species. Measurements are height of seedlingin (days)Acer palmatumQuercus rubraMorus selecting all of the data , including the headings, punch the plot icon and thenjust hit the NEXT buttons and then the finish buttons. Figure 1 shows what might comeof it. Obviously, you must make some choices right from the lot of things are wrong with figure 1.
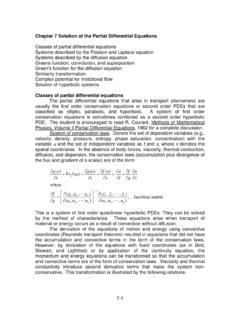
3 The most grievous error is that theindependent variable was not recognized as such. All data were plotted versus rownumber, which is the program default for column, bar, and line charts. The plot type isnot appropriate either. Column type graphs are best used for independent variables in thePlotting with Microsoft Excel2form of categories. To show a relationship between continuous variables such as heightversus time, one would typically use a line graph or a scatter plot with trend you want to see just how inappropriate (even bizarre) some plot types are for thesekinds of data , try making a "Doughnut," "Radar," or "Surface" chart with the same (days)Acer palmatumQuercus rubraMorus albaFig. 1. First attempt at Plotting a time course of seedling growth using Microsoft A GRAPH TYPENow try selecting a line graph, then go to the finish without choosing other (days)Acer palmatumQuercus rubraMorus albaFig.
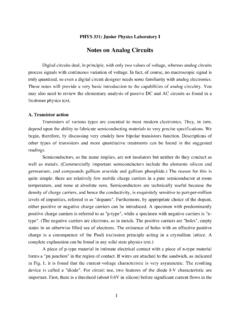
4 2. Attempt at using a line with Microsoft Excel3 Obviously, the phrase "line graph" means something different, to the Microsoft Excelprogrammers, than it does to most of the rest of us. When you choose line graph inExcel, the program still treats the independent variable as a set of categories. Time is acontinuous variable, so the x axis should go from zero to twenty days. In fact, time itselfis treated as a dependent a scatter plotSelect the category "XY (Scatter)" and go with the palmatumQuercus rubraMorus albaFig. 3. Table 1 data as a scatter plot , default ! It seems that if you want the x axis to represent a continuous variable, you mustselect a scatter plot . Notice that this plot type recognizes the first column of data as thedependent Chart/Source you can delete or add dependent variables and/orchange the independent variable. The program lets you make the selection directly on thechart, by highlighting the desired column(s) of data .
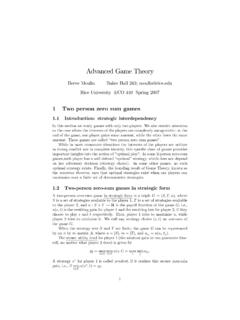
5 You might want to practice a THE ESSENTIALSYou don't need to add much to your scatter plot to make it acceptable. The axesshould be labeled, of course. There should also be some kind of trend line for each dataset. Under Chart you have the opportunity to enter axis that in a typical publication the figure caption goes beneath the graph. Wedon't give a graph a title, which Excel places above the figure 4, smooth trend lines were added from the Chart menu by selectinga different option for the type of scatter plot . You must let the data "tell you" what typeof lines are appropriate. See the documents on error analysis and curvefitting and thesummary, with Microsoft Excel4( ~labgroup/ ~labgroup/ (days)seedling height (cm)Acer palmatumQuercus rubraMorus albaFig. 4. Scatter plot with axis labels and smoothed trend curve fittingThe lines in the graph of figure 4 are what the program calls "smoothed lines.)
6 "Another choice is to use straight lines connecting the data points, a method also called"interpolation." In either case, the lines are strictly there to help guide the eye. Suchlines are not theoretical curve fits. True curve fitting is based upon mathematicalmethods such as the method of least squares, and frequently requires the use of replicatesamples, means, and standard 5. Scatter plots with inappropriate trend with Microsoft Excel5A true curve fit often does not intersect each and every data point. Figure 5shows examples of inappropriate choices of trend lines. The data are obviously scattereddue to experimental error, but the student used interpolation anyway. In figure 6 thesame data are visualized using a user-defined trend 6. Scattered data visualized using a user-defined trend lineSee our document on error representation and curvefitting for introductory materialon experimental error, its representation on graphs, and for basic material on NON-ESSENTIALSNow that the basic plot is ready (back to figure 4), let's make it acceptable forpublication by getting rid of the "computer junk," and shaping it Chart the gridlines tab allows you to extend the axis tic marks acrossthe plot area, a feature that is completely non-essential to the effectiveness of this note, however, that some publications allow tic marks to enter the graph space, and agrid may be positively useful if you intend to read numbers from the the gridlines from the major y axis units.
7 You don't need the gray fill or theborders either. Double click in the graph area and you can choose "none" for border andarea. Double click the border around the entire figure, and you can choose "none" for thelarger border around the whole thing. The result should resemble the graph in figure with Microsoft Excel60246810121416180510152025time (days)seedling height (cm)Acer palmatumQuercus rubraMorus albaFig. 7. Gridlines and borders a presentation, you may wish to include a legend in the plot area, extended ticmarks, color, borders, and perhaps other "bells and whistles." What you choose to dodepends on the purpose of the figure. Just make sure that it you are the one making shading reduces contrast, borders serve no useful purpose, color isseldom used for a published graph, and conventions often require the legend to beincluded in the figure caption, not in the plot area itself.
8 Many journals ignore formerconventions and permit all sorts of trend lines and legends, as long as they are useful,appropriate, and print journals we seldom use color. It adds to publication costs, and consider thatthere are color blind people. Getting rid of color can be a little trickier. Select one of thedata points to highlight the whole set. Go to Format/Selected data and makeeverything black, both for lines and data symbols. Play with symbol size and style, tryingdifferent options until you see what you want. An editor may require specific plotsymbols, by the way, further stifling your creative with Microsoft Excel70246810121416180510152025time (days)seedling height (cm)Acer palmatumQuercus rubraMorus albaFig. 8. More formatting changes - larger symbols, different line styles, allblack and So your figure isn't so colorful anymore. So what? No one will be upset if youfigure has all of the essentials and none of the non-essentials.
9 Now we'll do a couple ofmore things, and we're AND ORIENTATIONNote that the plot area of figure 8 is a bit wider than it is tall. What is most important- the time axis, the height axis, or the relationship between the two? To show therelationship most effectively, square up the plot area by selecting the graph, grabbing ananchor point with the mouse, and changing the axis you were Plotting a single function, then creating a square plot area, and having atleast one data point near the end of each axis should display the slope (in this case rate ofgrowth) most effectively. To best show the differences among the three rates of growth,you might adjust proportions so that the middle set ( data for Acer palmatum) produces aslope near forty-five degrees. The y axis would have to be taller than the x axis is adjustments are a matter of personal preference and perhaps trial and error to seewhat looks y axis label is easier to read in a horizontal orientation.
10 You can double click onthe label, select the alignment tab in the dialog box, and change the orientation tohorizontal. You may have to re-do the proportions. The legend might work better placedin the field itself (area within the ranges of the axes. You can simply move it to a produce figure 9, make the recommended changes to figure 8 then select the chart,go to Format/Selected Chart , select the Font tab, and make all of your titles/labelsthe same font and size. Changing proportions and copying/pasting apparently affectstype proportions and everything. By the way, the choice of font style is yours to make,but fancy, elaborate styles can be hard to read and distracting. We went with Times, 18point in the Excel document before pasting it an informative caption, and you're with Microsoft Excel80246810121416180510152025time (days)seedling height (cm)Acer palmatumQuercus rubraMorus albaFig.)