Transcription of Standard Deviation Worksheet - PC\|MAC
1 Standard Deviation Worksheet Name_____. 1. List the steps for calculating the Standard Deviation of a data set. 2. Find the mean, median, mode, range and the Standard Deviation of the following data set. (Round all numbers in the table to the tenth one decimal place). a) Experiment A = 1, 3, 5, 15, 2, 11, 12, 9. Mean - Median- Mode- Range- Data Item Difference Difference2. Mean of Squared Differences . Standard Deviation - b) Experiment B = 21, 23, 24, 25 , 29, 16, 34, 39. Mean - Median- Mode- Range- Data Item Difference Difference2. Mean of Squared Differences . Standard Deviation - c) Experiment C = 101, 117, 114, 107, 123, 121, 109, 110. Mean - Median- Mode- Range- Data Item Difference Difference2. Mean of Squared Differences . Standard Deviation - 3) List the three data sets from above from the least spread out to the most spread out.. Explain how you made this decision. 4) Suppose that each data set represents the results from an experiment. If we ended up with each of the following results for the experiments would you consider the new result Ordinary or Rare?
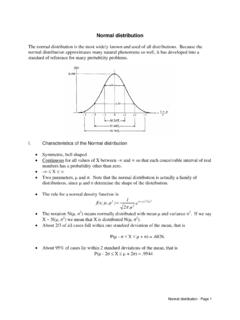
2 Why? Use the properties of the Normal Distribution Curve to make your decision. Experiment A = 13. Experiment B = 40. Experiment C = 100. For each of the following questions you need to do two things . a) Label the normal distribution curve b) Answer the question A local pretzel company has recently been receiving a number of complaints about the number of pretzels they are putting in a bag. This has caused them to do some research. They have determined that their pretzel packager fills the bag with a mean of 1 lb of pretzels and a Standard Deviation of .025 lbs. The researchers have determined that any bag containing more than lbs of pretzels will have too many pretzels and this will result in broken pretzels, but a bag that contains less than .975 lbs of pretzels seems to empty to customers. Based on this information what percentage of the company's pretzel bags are resulting in customer complaints? A local man, who never took math very seriously, is trying to start a new tire company.
3 He has researched several of the major tire company's warranty programs. He wants to provide better service than some of these other companies so he has decided that instead of the typical three year warranty he would like to provide a four year warranty on his tires. His future plant manager has advised him that he is not sure what to do about the warranty but he does know that the tires he will produce will have a mean lifetime of 1200 days with a Standard Deviation of 50 days. Estimate the percent of tires that this man would have to replace if he went with the four waranty.