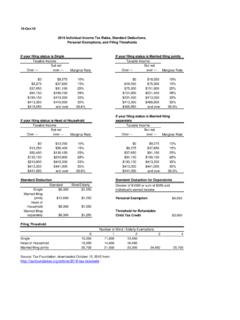
Transcription of Individual Income Tax Rates, 2016 - irs.gov
1 27 Section 3 Individual Income Tax Rates, 20161 For Tax Years 1988 through 1990, the tax rate schedules provided only two basic rates: 15 percent and 28 percent. However, taxable Income over certain levels was subject to a 33-percent tax rate to phase out the benefit of the 15-percent tax bracket (as compared to the 28-percent rate) and the deduction for personal exemptions. At the taxable Income level where these benefits were completely phased out, the tax rate returned to 28 section discusses the Individual Income tax rates and the computation of total Income tax for 2016 . It provides explanations of selected terms and describes the Income tax structure, certain tax law changes, Income and tax concepts ( modified taxable Income and marginal tax rates), and the computation of alternative minimum taxable Income .
2 Income Tax RatesThis part focuses on two distinct tax rates: average tax rates and marginal tax rates. Average tax rates are calculated by dividing some measure of tax by some measure of Income . For the statistics provided here within, the average tax rate is total Income tax (see Explanation of Terms section) divided by adjusted gross Income (AGI) reported on returns showing Income tax of marginal tax rates focus on determining the tax rate imposed on the last (or next) dollar of Income received by a taxpayer. The marginal tax rate is the statutory rate at which the last dollar of taxable Income received by a taxpayer is taxed.
3 (See Income and Tax Concepts in this section for a more detailed explanation.) Below is a more detailed descrip-tion of the measurement of average and marginal tax rates and a discussion of the statistics based on these rates for A presents statistics for 1986 through 2016 on Income (based on each year s definition of AGI) and taxes reported. These tax years can be partitioned into nine distinct periods:Tax Year 1986 This was the last year under the Economic Recovery Tax Act of 1981 (ERTA81). The tax bracket bound-aries, personal exemptions, and standard deductions were in-dexed for inflation, and the maximum tax rate was 50 ) Tax Year 1987 This was the first year under the Tax Reform Act of 1986 (TRA86).
4 For 1987, a 1-year, tran-sitional, five-rate tax bracket structure was established with a partial phase-in of new provisions that broad-ened the definition of AGI. The maximum tax rate was ) Tax Years 1988 through 1990 During this period there was effectively a three-rate tax bracket The phase-in of the provisions of TRA86 con-tinued with a maximum tax rate of 33 ) Tax Years 1991 and 1992 These years brought a three-rate tax bracket structure (with a maximum tax rate of 31 percent), a limitation on some itemized de-ductions, and a phase-out of personal exemptions for some upper- Income ) Tax Years 1993 through 1996 This period had a five-rate tax bracket structure (with a maximum statutory tax rate of percent)
5 , a limitation on some itemized deductions, and a phase-out of personal exemptions for some upper- Income ) Tax Years 1997 through 2000 These years were sub-ject to the Taxpayer Relief Act of 1997, which added three new capital gain tax rates to the previous rate structure to form a new eight-rate tax bracket struc-ture (with a maximum statutory tax rate of per-cent). For a more detailed description of the capital gain rates, see Income and Tax Concepts ) Tax Years 2001 through 2008 This period was af-fected mainly by two new laws, the Economic Growth and Tax Relief Reconciliation Act of 2001 (EGTRRA) and the Jobs and Growth Tax Relief Reconciliation Individual Income Tax Returns 2016 Individual Income Tax Rates, 201628 Act of 2003 (JGTRRA).
6 EGTRRA included a new 10-percent tax rate bracket, as well as reductions in tax rates for brackets higher than 15 percent of one-half percentage point for 2001 and 1 percentage point for 2002. It also included increases in the child tax credit and an increase in alternative minimum tax exemp-tions. Under JGTRRA, Tax Year 2003 saw additional rate reductions (accelerations of EGTRRA s phased-in reductions) in ordinary marginal tax rates higher than the 15-percent rate, as well as expansions to par-ticular Income thresholds in the rates from 15 percent and below. The rate for most long-term capital gains was reduced from 20 percent to 15 percent; further, qualified dividends were taxed at this same 15-percent rate.
7 Beginning in 2004, the Working Families Tax Relief Act increased the additional child tax credit refundable rate from 10 percent to 15 percent. Under EGTRRA, beginning in 2006, the complete phase-out of personal exemptions and the limitation on some itemized deductions for upper- Income taxpayers were modified to limit the maximum phase-out to two-thirds of both the exemption amount and the itemized deduction limitation amount. For 2008, the limit was changed to one-third. 7) Tax Years 2009 through 2012 Beginning in 2009, the American Recovery and Reinvestment Act (ARRA) temporarily increased the earned Income credit by modifying calculations on qualifying earned Income amounts and phase-out ranges.
8 The Act increased eligibility for receiving the refundable portion of the child tax credit for 2009 and 2010 by lowering the Taxable returnsAverage per return (whole dollars) [3]Current dollarsConstant dollars [4](1)(2)(3)(4)(5)(6)(7)(8)(9)(10)Using each tax year's adjusted gross Income (less deficit)1986103,045,170 83,967,413 2,440 367 29,062 4,374 26,516 3,991 1987106,996,270 86,723,796 2,701 369 31,142 4,257 27,414 3,747 1988109,708,280 87,135,332 2,990 413 34,313 4,738 29,005 4,005 1989112,135,673 89,178,355 3,158 433 35,415 4,855 28,560 3,915 1990113,717,138 89,862,434 3,299 447 36,711 4,976 28,088 3,807 1991114,730,123 88,733,587 3,337 448 37,603 5,054 27,609 3,711 1992113,604,503 86,731.
9 946 3,484 476 40,168 5,491 28,630 3,914 1993114,601,819 86,435,367 3,564 503 41,233 5,817 28,535 4,026 1994115,943,131 87,619,446 3,737 535 42,646 6,104 28,776 4,119 1995118,218,327 89,252,989 4,008 588 44,901 6,593 29,463 4,326 1996120,351,208 90,929,350 4,342 658 47,750 7,239 30,433 4,614 1997122,421,991 93,471,200 4,765 731 50,980 7,824 31,763 4,875 1998124,770,662 93,047,898 5,160 789 55,458 8,475 33,836 5,171 1999127,075,145 94,546,080 5,581 877 59,028 9,280 35,431 5,570 2000129,373,500 96,817,603 6,083 981 62,832 10,129 36,488 5,882 2001130,255,237 94,763,530 5,847 888 61,702 9,370 34,840 5,291 2002130,076,443 90,963,896 5,641 797 62,015 8,762 34,472 4,870 2003130,423,626 88,921,904 5,747 748 64,625 8,412 35,122 4,572 2004132,226,042 89,101,934 6,266 832 70.
10 318 9,337 37,225 4,943 2005134,372,678 90,593,081 6,857 935 75,687 10,319 38,754 5,284 2006[5] 138,394,754 92,740,927 7,439 1,024 80,218 11,041 39,791 5,477 2007[6] 142,978,806 96,272,958 8,072 1,116 83,851 11,588 40,449 5,590 2008142,450,569 90,660,104 7,583 1,032 83,647 11,379 38,851 5,285 2009140,494,127 81,890,189 6,778 866 82,765 10,575 38,579 4,929 2010142,892,051 84,475,933 7,246 952 85,778 11,266 39,338 5,166 2011145,370,240 91,694,201 7,693 1,046 83,901 11,402 37,299 5,069 2012144,928,472 93,109,721 8,442 1,188 90,669 12,759 39,491 5,557 2013147,351.
